Acer 2008 Annual Report Download - page 30
Download and view the complete annual report
Please find page 30 of the 2008 Acer annual report below. You can navigate through the pages in the report by either clicking on the pages listed below, or by using the keyword search tool below to find specific information within the annual report.-
 1
1 -
2
-
3
-
4
-
5
-
6
-
7
-
8
-
9
-
10
-
11
-
12
-
13
-
14
-
15
-
16
-
17
-
18
-
19
-
 20
20 -
 21
21 -
 22
22 -
 23
23 -
 24
24 -
 25
25 -
 26
26 -
 27
27 -
 28
28 -
 29
29 -
 30
30 -
 31
31 -
 32
32 -
 33
33 -
 34
34 -
 35
35 -
 36
36 -
 37
37 -
 38
38 -
 39
39 -
 40
40 -
41
-
42
-
43
-
44
-
45
-
46
-
47
-
48
-
49
-
50
-
51
-
52
-
53
-
54
-
55
-
56
-
57
-
58
-
59
-
60
-
61
-
62
-
63
-
64
-
65
 |
 |
Acer Incorporated 2008 Annual Report56
Financial Standing
Acer Incorporated 2008 Annual Report 57
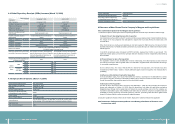
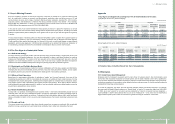
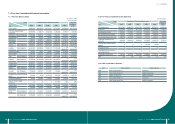
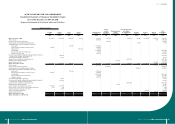
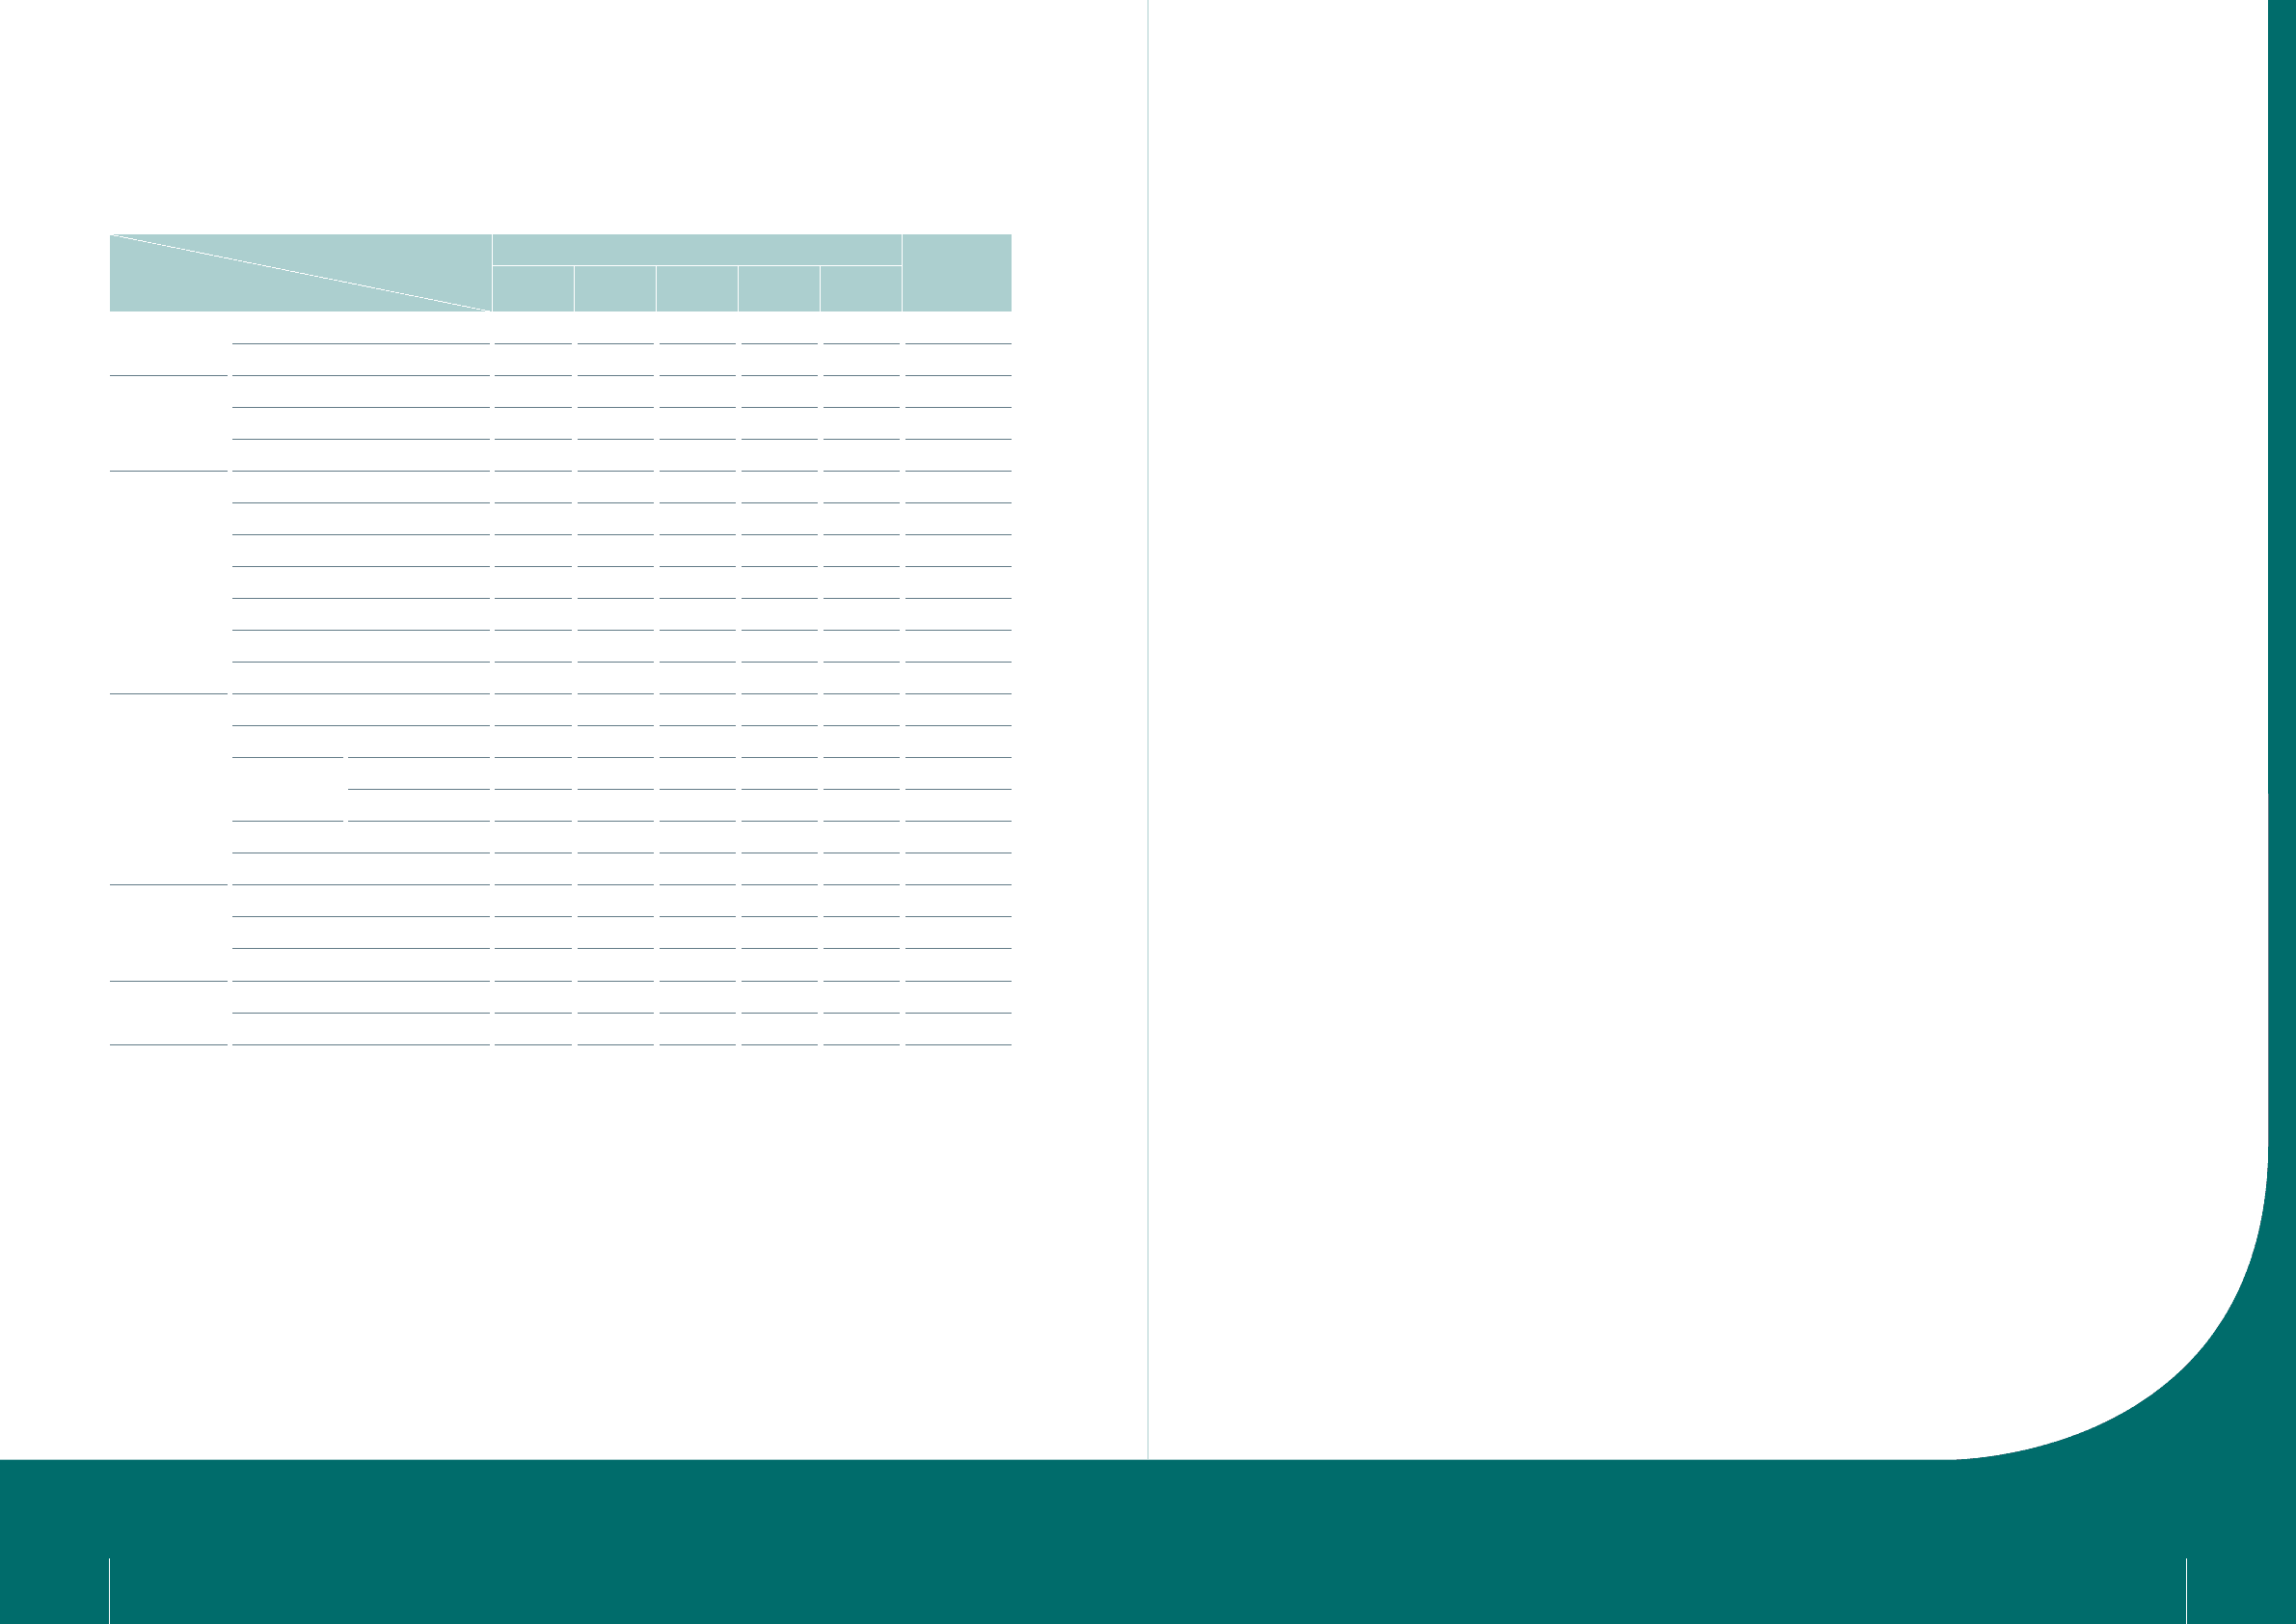
7.2 Five-Year Financial Analysis
Period
Item
Most Recent 5-Year Financial Information Current Year
as of Mar.31,
2009
2004 2005 2006 2007 2008
Financial Ratio
(%)
Total liabilities to Total Assets 50.01 60.81 59.92 68.18 65.96 67.14
Long-term Debts to Fixed Assets 480.13 733.23 1,268.55 1,162.99 1,008.19 1,055.82
Ability to
Payoff Debt
Current Ratio (%) 141.96 136.30 146.65 134.15 124.83 122.50
Quick Ratio (%) 117.11 106.20 121.20 106.32 95.47 99.30
Interest Protection 15 29 33 21 12 14
Ability to
Operate
A/R Turnover (times) 7.28 6.05 5.26 5.34 5.18 4.61
A/R Turnover days 50 60 69 68 70 79
Inventory Turnover (times) 17.52 13.39 12.01 13.88 13.24 11.64
Inventory Turnover days 21 27 30 26 28 31
A/P Turnover (times) 7.80 5.67 4.72 5.63 6.39 5.62
Fixed Assets Turnover (times) 16.73 33.60 56.67 53.50 58.51 51.43
Total Assets Turnover (times) 1.81 1.85 1.86 1.90 2.24 1.81
Earning Ability
Return on Assets (%) 6.17 5.92 5.85 6.27 5.23 3.45
Return on Equity (%) 11.07 13.10 14.31 16.94 14.65 9.58
To Pay-in
Capital %
Operating Income 18.18 33.93 31.93 42.34 53.25 38.91
PBT 41.28 47.25 57.97 62.81 56.03 41.70
Net Income Ratio (%) 3.12 2.67 2.91 2.80 2.15 1.70
EPS (NTD) 2.86 3.48 4.20 5.33 4.72 0.78
Cash ow(%)
Cash Flow Ratio 3.40 6.97 12.03 (4.59) (3.46) 19.08
Cash Flow Adequacy Ratio 19.96 46.41 61.02 26.47 17.55 45.37
Cash Reinvestment Ratio (4.24) 3.11 7.89 (19.89) (21.40) 48.05
Leverage
Operating Leverage 4.90 2.93 3.45 2.99 3.14 3.83
Financial Leverage 1.19 1.05 1.06 1.08 1.10 1.09
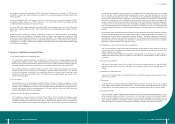
1. Financial Ratio
(1) Total liabilities to total assets = Total liabilities / Total assets
(2) Long-term funds to xed assets = (Net equity + Long term debts) / Net xed assets
2. Ability to Pay off debt
(1) Current ratio = Current Assets / Current liability
(2) Quick ratio = (Current assets ‒ Inventory ‒ Prepaid expenses) / Current liability
(3) Interest protection = Net income before income tax and interest expense / Interest expense
3. Ability to Operate
(1) Account receivable (including account receivable and notes receivable from operation) turnover = Net sales /
the average of account receivable (including account receivable and notes receivable from operation) balance
(2) A/R turnover day = 365 / account receivable turnover
(3) Inventory turnover = Cost of goods sold / the average of inventory
(4) Account payable (including account payable and notes payable from operation)turnover = Cost of goods sold /
the average of account payable (including account payable and notes payable from operation) balance
(5) Inventory turnover day = 365 / Inventory turnover
(6) Fixed assets turnover = Net sales / Net Fixed Assets
(7) Total assets turnover = Net sales / Total assets
4. Earning Ability
(1) Return on assets = [PAT + Interest expense×(1 ‒ interest rate)] / the average of total assets
(2) Return on equity = PAT / the average of net equity
(3) Net income ratio = PAT - Net sales
(4) EPS = (PAT - Dividend from prefer stock) / weighted average outstanding shares
5. Cash Flow
(1) Cash ow ratio = Cash ow from operating activities / Current liability
(2) Cash ow adequacy ratio = Most recent 5-year Cash ow from operating activities / Most recent 5-year (Capital
expenditure + the increase of inventory + cash dividend)
(3) Cash reinvestment ratio = (Cash ow from operating activities ‒ cash dividend) / (Gross xed assets + long-
term investment + other assets + working capital)
6. Leverage
(1) Operating leverage = (Net revenue ‒ variable cost of goods sold and operating expense) / operating income
(2) Financial leverage = Operating income / (Operating income ‒ interest expenses)