Acer 2008 Annual Report Download - page 45
Download and view the complete annual report
Please find page 45 of the 2008 Acer annual report below. You can navigate through the pages in the report by either clicking on the pages listed below, or by using the keyword search tool below to find specific information within the annual report.-
 1
1 -
2
-
3
-
4
-
5
-
6
-
7
-
8
-
9
-
10
-
11
-
12
-
13
-
14
-
15
-
16
-
17
-
18
-
19
-
20
-
21
-
22
-
23
-
24
-
25
-
26
-
27
-
28
-
29
-
30
-
31
-
32
-
33
-
34
-
 35
35 -
 36
36 -
 37
37 -
 38
38 -
 39
39 -
 40
40 -
 41
41 -
 42
42 -
 43
43 -
 44
44 -
 45
45 -
 46
46 -
 47
47 -
 48
48 -
 49
49 -
 50
50 -
 51
51 -
 52
52 -
 53
53 -
 54
54 -
 55
55 -
56
-
57
-
58
-
59
-
60
-
61
-
62
-
63
-
64
-
65
 |
 |

Acer Incorporated 2008 Annual Report86
Financial Standing
Acer Incorporated 2008 Annual Report 87
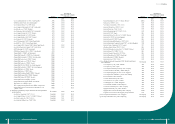
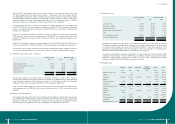
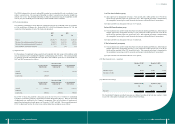
As of December 31, 2007 and 2008, details of nancial instruments described above that were outstanding
were as follows:
(a) Foreign currency options
(i) Long position
December 31, 2008
Notional amount (in thousands) Maturity date
USD CALL/AUD PUT USD 6,445 2009/01/28~2009/02/25
EUR CALL/GBP PUT EUR 43,257 2009/01/30~2009/03/31
USD CALL/EUR PUT USD 6,000 2009/01/30
NZD CALL/USD PUT USD 1,000 2009/01/28~2009/02/25
EUR CALL/NOK PUT EUR 4,200 2009/01/15
EUR CALL/SEK PUT EUR 3,900 2009/01/15
(ii) Short position
December 31, 2008
Notional amount (in thousands) Maturity date
AUD CALL/USD PUT USD 6,445 2009/01/28~2009/02/25
GBP CALL/EUR PUT EUR 55,984 2009/01/30~2009/03/31
EUR CALL/USD PUT USD 6,000 2009/01/30
USD CALL/NZD PUT USD 1,000 2009/01/28~2009/02/25
NOK CALL/EUR PUT EUR 4,200 2009/01/15
SEK CALL/EUR PUT EUR 5,850 2009/01/15
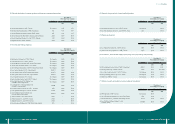
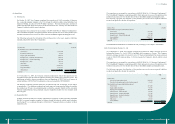
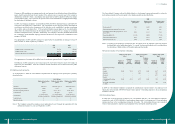
(b) Foreign currency forward contracts
December 31, 2007
Notional amount
(in thousands)
Settlement date
Buy Sell
EUR / NOK EUR 9,000 2008/01/15
EUR / SEK EUR 8,500 2008/01/15
EUR / GBP EUR 170,577 2008/01/31~2008/04/16
USD / EUR USD 77,666 2008/01/01~2008/03/31
USD / AUD USD 50,268 2008/01/11~2008/02/28
USD / NZD USD 5,940 2008/01/31~2008/03/31
AUD / NZD AUD 3,531 2008/01/07~2008/02/05
USD / CAD USD 4,094 2008/02/19~2008/02/28
December 31, 2008
Notional amount
(in thousands) Settlement date
Buy Sell
USD / AUD USD 68,190 2009/01/30~2009/05/29
AUD / USD USD 11,867 2009/01/30~2009/04/30
USD / CAD USD 39,095 2009/02/26~2009/04/30
EUR / DKK EUR 94 2009/01/15
USD / EUR EUR 252,798 2009/01/30~2009/03/16
EUR / GBP EUR 165,369 2009/01/15~2009/02/27
EUR / NOK EUR 14,311 2009/01/13~2009/02/27
USD / NZD USD 4,500 2009/01/30~2009/05/29
EUR / SEK EUR 19,612 2009/01/13~2009/02/27
USD /JPY USD 70,000 2009/01/15~2009/05/29
USD / ZAR USD 17,300 2009/01/15~2009/03/31
USD /MXN USD 90,000 2009/01/09~2009/04/17
(c) Foreign exchange swap
December 31, 2008
Notional amount (in thousands) Settlement date
Swap-in SEK/Swap-out EUR SEK 17,000 / EUR 1,554 2009/01/15
(7) Inventories
December 31,
2007
December 31,
2008
NT$ NT$ US$
Raw materials 12,452,588 14,528,727 442,706
Work in process 27,322 49,437 1,506
Finished goods 13,809,255 16,907,906 515,202
Spare parts 3,982,372 4,544,547 138,477
Inventories in transit 7,630,204 9,233,802 281,364
Less: provision for inventory obsolescence
and net realizable value (4,086,044) (5,236,224) (159,553)
33,815,697 40,028,195 1,219,702
(8) Noncurrent assets held for sale
In December 2007, the Company’s subsidiary ACI planned to sell its ofce building located in Singapore. As
a result, the ofce building, recorded at NT$764,718, was reclassied to noncurrent asset held for sale under
“prepayments and other current assets” in the accompanying consolidated balance sheet as of December 31,
2007. In March 2008, the sale of the ofce building was completed.