2K Sports 2004 Annual Report Download - page 68
Download and view the complete annual report
Please find page 68 of the 2004 2K Sports annual report below. You can navigate through the pages in the report by either clicking on the pages listed below, or by using the keyword search tool below to find specific information within the annual report.-
 1
1 -
2
-
3
-
4
-
5
-
6
-
7
-
8
-
9
-
10
-
11
-
12
-
13
-
14
-
15
-
16
-
17
-
18
-
19
-
20
-
21
-
22
-
23
-
24
-
25
-
26
-
27
-
28
-
29
-
30
-
31
-
32
-
33
-
34
-
35
-
36
-
37
-
38
-
39
-
40
-
41
-
42
-
43
-
44
-
45
-
46
-
47
-
48
-
49
-
50
-
51
-
52
-
53
-
54
-
55
-
56
-
57
-
 58
58 -
 59
59 -
 60
60 -
 61
61 -
 62
62 -
 63
63 -
 64
64 -
 65
65 -
 66
66 -
 67
67 -
 68
68 -
 69
69 -
 70
70 -
 71
71 -
 72
72 -
 73
73 -
 74
74 -
 75
75 -
 76
76 -
 77
77 -
 78
78 -
79
-
80
 |
 |

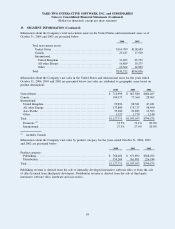
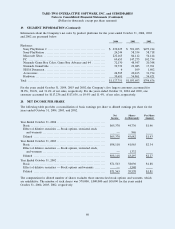
Information about the Company’s net sales by product platforms for the years ended October 31, 2004, 2003
and 2002 are presented below:
2004 2003 2002
Platforms:
Sony PlayStation 2 ................................................. $ 639,625 $ 591,205 $473,214
Sony PlayStation ................................................... 24,244 58,334 58,718
Microsoft Xbox .................................................... 222,165 84,112 54,144
PC ................................................................. 69,653 147,275 102,734
Nintendo Game Boy Color, Game Boy Advance and 64 ........... 72,130 48,547 20,348
Nintendo GameCube ............................................... 39,732 29,085 17,761
SEGA Dreamcast ................................................... 6 109 1,602
Accessories ......................................................... 24,505 20,165 31,734
Hardware ........................................................... 35,691 54,861 34,421
Total .................................................................. $1,127,751 $1,033,693 $794,676
For the years ended October 31, 2004, 2003 and 2002, the Company’s five largest customers accounted for
38.9%, 38.6%, and 31.4% of net sales, respectively. For the years ended October 31, 2004 and 2003, one
customer accounted for $117,236 and $117,636, or 10.4% and 11.4%, of net sales, respectively.
20. NET INCOME PER SHARE
The following table provides a reconciliation of basic earnings per share to diluted earnings per share for the
years ended October 31, 2004, 2003, and 2002.
Net
Income
Shares
(in thousands)
Per Share
Amount
Year Ended October 31, 2004 .........................................
Basic ............................................................... $65,378 44,736 $1.46
Effect of dilutive securities — Stock options, restricted stock
and warrants ..................................................... — 946
Diluted ............................................................. $65,378 45,682 $1.43
Year Ended October 31, 2003 .........................................
Basic ............................................................... $98,118 41,965 $2.34
Effect of dilutive securities — Stock options, restricted stock,
and warrants ..................................................... — 1,332
Diluted ............................................................. $98,118 43,297 $2.27
Year Ended October 31, 2002 .........................................
Basic ............................................................... $71,563 38,030 $1.88
Effect of dilutive securities — Stock options and warrants ......... — 1,540
Diluted ............................................................. $71,563 39,570 $1.81
The computation for diluted number of shares excludes those unexercised stock options and warrants, which
are antidilutive. The number of such shares was 579,000, 1,000,000 and 143,000 for the years ended
October 31, 2004, 2003, 2002, respectively.
TAKE-TWO INTERACTIVE SOFTWARE, INC. and SUBSIDIARIES
Notes to Consolidated Financial Statements (Continued)
(Dollars in thousands, except per share amounts)
19. SEGMENT INFORMATION (Continued)
60