2K Sports 2004 Annual Report Download - page 26
Download and view the complete annual report
Please find page 26 of the 2004 2K Sports annual report below. You can navigate through the pages in the report by either clicking on the pages listed below, or by using the keyword search tool below to find specific information within the annual report.-
 1
1 -
2
-
3
-
4
-
5
-
6
-
7
-
8
-
9
-
10
-
11
-
12
-
13
-
14
-
15
-
 16
16 -
 17
17 -
 18
18 -
 19
19 -
 20
20 -
 21
21 -
 22
22 -
 23
23 -
 24
24 -
 25
25 -
 26
26 -
 27
27 -
 28
28 -
 29
29 -
 30
30 -
 31
31 -
 32
32 -
 33
33 -
 34
34 -
 35
35 -
 36
36 -
37
-
38
-
39
-
40
-
41
-
42
-
43
-
44
-
45
-
46
-
47
-
48
-
49
-
50
-
51
-
52
-
53
-
54
-
55
-
56
-
57
-
58
-
59
-
60
-
61
-
62
-
63
-
64
-
65
-
66
-
67
-
68
-
69
-
70
-
71
-
72
-
73
-
74
-
75
-
76
-
77
-
78
-
79
-
80
 |
 |

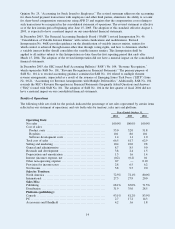
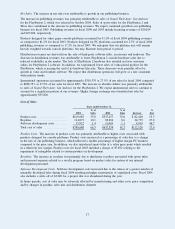
Operating Expenses
Years ended October 31,
2004
%of
Sales 2003
%of
Sales
Increase
(Decrease)
%
Incr
(Decr)
Selling and marketing ................ $117,606 10.4 $103,015 10.0 $14,591 14.2
General and administrative ........... 98,226 8.7 88,083 8.5 10,143 11.5
Research and development ........... 43,259 3.8 25,107 2.4 18,152 72.3
Depreciation and amortization ....... 16,846 1.5 16,923 1.6 (77) (0.5)
Total operating expenses ............. $275,937 24.4 $233,128 22.5 $42,809 18.4
Selling and marketing. The increase in selling and marketing expense was attributable to increased levels of
advertising and promotional support for existing and new titles, specifically the ESPN sports titles, as well as
higher personnel expenses, and is consistent with the growth of our business.
General and administrative. The increase in general and administrative expense was principally attributable
to higher professional fees and rent, partly offset by the absence of a fiscal 2003 charge of $7,028 associated
with the consolidation of our distribution operations. Higher professional fees were incurred in connection
with legal and regulatory matters and were partly offset by the reimbursement of $922 of legal fees from
insurance proceeds. The increase in rent expense included costs associated with relocating a European office
and additional space in our corporate offices.
Research and development. Research and development costs increased primarily due to the acquisitions
of development studios, as well as increased personnel costs. Once software development projects reach
technological feasibility, which is relatively early in the development process, a substantial portion of our
research and development costs are capitalized and subsequently amortized as cost of goods sold.
Depreciation and amortization. In fiscal 2003, we incurred a $4,407 charge related to the impairment of
a customer list from a previous acquisition as a result of the consolidation of our distribution operations.
Excluding this fiscal 2003 charge, there was an increase in depreciation and amortization in fiscal 2004
principally due to higher depreciation related to the build out of our corporate offices and the implementation
of software systems.
Income from Operations. Income from operations decreased by $60,877 or 37.3%, to $102,134 for fiscal
2004 from $163,011 for fiscal 2003, due to the changes referred to above. Higher foreign exchange rates
benefited income from operations by approximately $1,074.
Interest Income, net. Interest income decreased by $289, or 12.8% for fiscal 2004, and was attributable to
interest earned on the invested cash.
Provision for Settlement. We recorded a provision of $7.5 million in connection with a proposed settlement
of an SEC investigation. See Note 11 to Consolidated Financial Statements.
Provision for Income Taxes. Income tax expense was $31,232 for fiscal 2004 as compared to $67,197 for
fiscal 2003. The decrease was primarily attributable to a lower effective tax rate and decreased taxable income
in fiscal 2004. The effective tax rate was 32.3% for fiscal 2004, as compared to 40.6% for fiscal 2003. The
fiscal 2004 tax provision included benefits from a change in the mix of earnings with a greater proportion
of income from lower tax jurisdictions (5.5% decrease to the effective tax rate) and from the extraterritorial
income benefit (ETI) (4.0% decrease to the effective tax rate) partially offset by the nondeductibility of the
$7.5 million proposed SEC settlement (2.3% increase to the effective rate). The fiscal 2003 tax provision
included the effect of a valuation allowance against capital loss and other carryforwards (6.31% increase to
the effective tax rate) partially offset by ETI (5.5% decrease to the effective tax rate).
At October 31, 2004, we had capital loss carryforwards totaling approximately $20,000. The capital loss
carryforwards will expire in the periods fiscal 2006 through fiscal 2008. Management does not expect to
generate sufficient taxable income from capital transactions prior to the expiration of these benefits, and
accordingly a valuation allowance was recorded in fiscal 2003 for this asset as it is more likely than not that
the deferred tax asset related to these carryforwards will not be realized. At October 31, 2004, we had foreign
net operating losses of approximately $11,000 expiring between 2005 and 2010, and state net operating losses
18