2K Sports 2004 Annual Report Download - page 67
Download and view the complete annual report
Please find page 67 of the 2004 2K Sports annual report below. You can navigate through the pages in the report by either clicking on the pages listed below, or by using the keyword search tool below to find specific information within the annual report.-
 1
1 -
2
-
3
-
4
-
5
-
6
-
7
-
8
-
9
-
10
-
11
-
12
-
13
-
14
-
15
-
16
-
17
-
18
-
19
-
20
-
21
-
22
-
23
-
24
-
25
-
26
-
27
-
28
-
29
-
30
-
31
-
32
-
33
-
34
-
35
-
36
-
37
-
38
-
39
-
40
-
41
-
42
-
43
-
44
-
45
-
46
-
47
-
48
-
49
-
50
-
51
-
52
-
53
-
54
-
55
-
56
-
 57
57 -
 58
58 -
 59
59 -
 60
60 -
 61
61 -
 62
62 -
 63
63 -
 64
64 -
 65
65 -
 66
66 -
 67
67 -
 68
68 -
 69
69 -
 70
70 -
 71
71 -
 72
72 -
 73
73 -
 74
74 -
 75
75 -
 76
76 -
 77
77 -
78
-
79
-
80
 |
 |

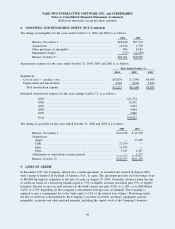
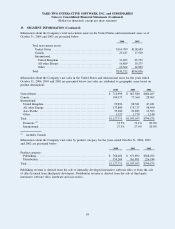
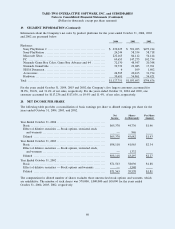
Information about the Company’s total non-current assets in the United States and international areas as of
October 31, 2004 and 2003 are presented below:
2004 2003
Total non-current assets:
United States ................................................... $163,709 $118,683
Canada ......................................................... 23,427 17,520
International:
United Kingdom ............................................. 31,263 25,739
All other Europe ............................................. 16,809 19,275
Other ........................................................ 10,364 12,839
Total .............................................................. $245,572 $194,056
Information about the Company’s net sales in the United States and international areas for the years ended
October 31, 2004, 2003 and 2002 are presented below (net sales are attributed to geographic areas based on
product destination):
2004 2003 2002
United States ......................................................... $ 712,999 $ 667,580 $606,467
Canada ................................................................ 104,373 77,360 28,965
International:
United Kingdom ................................................... 99,896 88,381 47,021
All other Europe ................................................... 173,880 175,717 98,490
Asia Pacific ........................................................ 35,280 22,885 12,593
Other................................................................ 1,323 1,770 1,140
Total .................................................................. $1,127,751 $1,033,693 $794,676
Domestic
(1)
........................................................ 72.5% 72.1% 80.0%
International ........................................................ 27.5% 27.9% 20.0%
(1)
includes Canada
Information about the Company’s net sales by product category for the years ended October 31, 2004, 2003
and 2002 are presented below:
2004 2003 2002
Product category:
Publishing........................................................... $ 768,482 $ 671,892 $568,492
Distribution ......................................................... 359,269 361,801 226,184
Total ................................................................... $1,127,751 $1,033,693 $794,676
Publishing revenue is derived from the sale of internally developed interactive software titles or from the sale
of titles licensed from third-party developers. Distribution revenue is derived from the sale of third-party
interactive software titles, hardware and accessories.
TAKE-TWO INTERACTIVE SOFTWARE, INC. and SUBSIDIARIES
Notes to Consolidated Financial Statements (Continued)
(Dollars in thousands, except per share amounts)
19. SEGMENT INFORMATION (Continued)
59