2K Sports 2004 Annual Report Download - page 19
Download and view the complete annual report
Please find page 19 of the 2004 2K Sports annual report below. You can navigate through the pages in the report by either clicking on the pages listed below, or by using the keyword search tool below to find specific information within the annual report.-
 1
1 -
2
-
3
-
4
-
5
-
6
-
7
-
8
-
 9
9 -
 10
10 -
 11
11 -
 12
12 -
 13
13 -
 14
14 -
 15
15 -
 16
16 -
 17
17 -
 18
18 -
 19
19 -
 20
20 -
 21
21 -
 22
22 -
 23
23 -
 24
24 -
 25
25 -
 26
26 -
 27
27 -
 28
28 -
 29
29 -
30
-
31
-
32
-
33
-
34
-
35
-
36
-
37
-
38
-
39
-
40
-
41
-
42
-
43
-
44
-
45
-
46
-
47
-
48
-
49
-
50
-
51
-
52
-
53
-
54
-
55
-
56
-
57
-
58
-
59
-
60
-
61
-
62
-
63
-
64
-
65
-
66
-
67
-
68
-
69
-
70
-
71
-
72
-
73
-
74
-
75
-
76
-
77
-
78
-
79
-
80
 |
 |

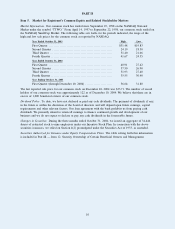
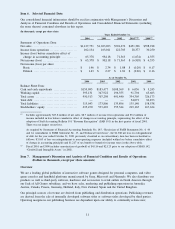
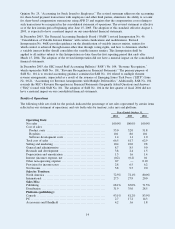
Item 6. Selected Financial Data
Our consolidated financial information should be read in conjunction with Management’s Discussion and
Analysis of Financial Condition and Results of Operations and Consolidated Financial Statements (including
the notes thereto) contained elsewhere in this report.
(In thousands, except per share data)
Years Ended October 31,
2004 2003 2002 2001
(1)(2)
2000
(2)
Statement of Operations Data:
Net sales ...................................... $1,127,751 $1,033,693 $794,676 $451,396 $358,918
Income from operations ....................... 102,134 163,011 122,705 28,377 30,250
Income (loss) before cumulative effect of
change in accounting principle ............. 65,378 98,118 71,563 (1,674) 4,555
Net income (loss) ............................. $ 65,378 $ 98,118 $ 71,563 $ (6,918) $ 4,555
Net income (loss) per share
Basic ....................................... $ 1.46 $ 2.34 $ 1.88 $ (0.20) $ 0.17
Diluted ..................................... $ 1.43 $ 2.27 $ 1.81 $ (0.20) $ 0.16
As of October 31,
2004 2003 2002 2001 2000
Balance Sheet Data:
Cash and cash equivalents .................... $155,095 $183,477 $108,369 $ 6,056 $ 5,245
Working capital ............................... 395,131 347,922 196,555 91,794 65,663
Total assets ................................... 950,513 707,298 491,440 354,305 326,173
Total debt ..................................... — — — 54,073 96,873
Total liabilities ................................ 315,043 173,806 135,896 135,140 158,538
Stockholders’ equity .......................... 635,470 533,492 355,544 219,165 167,634
(1)
Includes approximately $23.8 million of net sales, $8.7 million of income from operations and $5.2 million of
income included in loss before cumulative effect of change in accounting principle, representing the effect of the
adoption of Staff Accounting Bulletin 101 “Revenue Recognition” (SAB 101) in the first quarter of fiscal 2001.
There was no impact on net loss.
As required by Statement of Financial Accounting Standards No. 145, “Rescission of FASB Statements No. 4, 44
and 64, Amendment to FASB Statement No. 13, and Technical Corrections”, the $1,948 net loss on extinguishment
of debt for the year ended October 31, 2001 previously classified as an extraordinary item has been reclassified as
follows: $3,165 of loss on extinguishment to non-operating expenses (included within loss before cumulative effect
of change in accounting principle) and $1,217 of tax benefit to benefit for income taxes in the above table.
(2)
Fiscal 2001 and 2000 includes amortization of goodwill of $4,116 and $2,123 prior to our adoption of SFAS 142,
“Goodwill and Intangible Assets” in 2002.
Item 7. Management’s Discussion and Analysis of Financial Condition and Results of Operations
(Dollars in thousands, except per share amounts)
Overview
We are a leading global publisher of interactive software games designed for personal computers, and video
game consoles and handheld platforms manufactured by Sony, Microsoft and Nintendo. We also distribute our
products as well as third-party software, hardware and accessories to retail outlets in North America through
our Jack of All Games subsidiary, and we have sales, marketing and publishing operations in Australia,
Austria, Canada, France, Germany, Holland, Italy, New Zealand, Spain and the United Kingdom.
Our principal sources of revenue are derived from publishing and distribution operations. Publishing revenues
are derived from the sale of internally developed software titles or software titles developed by third parties.
Operating margins in our publishing business are dependent upon our ability to continually release new,
11