2K Sports 2004 Annual Report Download - page 65
Download and view the complete annual report
Please find page 65 of the 2004 2K Sports annual report below. You can navigate through the pages in the report by either clicking on the pages listed below, or by using the keyword search tool below to find specific information within the annual report.-
 1
1 -
2
-
3
-
4
-
5
-
6
-
7
-
8
-
9
-
10
-
11
-
12
-
13
-
14
-
15
-
16
-
17
-
18
-
19
-
20
-
21
-
22
-
23
-
24
-
25
-
26
-
27
-
28
-
29
-
30
-
31
-
32
-
33
-
34
-
35
-
36
-
37
-
38
-
39
-
40
-
41
-
42
-
43
-
44
-
45
-
46
-
47
-
48
-
49
-
50
-
51
-
52
-
53
-
54
-
 55
55 -
 56
56 -
 57
57 -
 58
58 -
 59
59 -
 60
60 -
 61
61 -
 62
62 -
 63
63 -
 64
64 -
 65
65 -
 66
66 -
 67
67 -
 68
68 -
 69
69 -
 70
70 -
 71
71 -
 72
72 -
 73
73 -
 74
74 -
 75
75 -
76
-
77
-
78
-
79
-
80
 |
 |

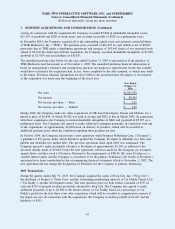
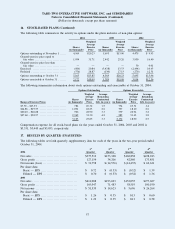
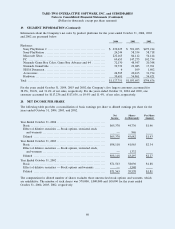
The following table summarizes the activity in options under the plans inclusive of non-plan options:
2004 2003 2002
Shares
(in thousands)
Weighted
Average
Exercise
Price
Shares
(in thousands)
Weighted
Average
Exercise
Price
Shares
(in thousands)
Weighted
Average
Exercise
Price
Options outstanding at November 1 ...... 4,569 $20.23 5,695 $13.96 4,479 $ 9.93
Granted-exercise price equal to
fair value ........................... 1,954 31.71 2,442 25.26 3,950 16.40
Granted-exercise price less than
fair value ........................... — — — — 30 0.01
Exercised ............................. (984) 20.84 (3,438) 13.53 (2,494) 10.43
Forfeited .............................. (376) 28.87 (130) 17.13 (270) 12.31
Options outstanding at October 31 ...... 5,163 $23.85 4,569 $20.23 5,695 $13.96
Options exercisable at October 31 ....... 2,172 $18.00 1,389 $15.09 3,014 $12.56
The following summarizes information about stock options outstanding and exercisable at October 31, 2004:
Options Outstanding Options Exercisable
Range of Exercise Prices
Shares
(in thousands)
Weighted
Average
Exercise
Price
Average
Remaining
Contractual
Life (in years)
Shares
(in thousands)
Weighted
Average
Exercise
Price
Average
Remaining
Contractual
Life (in years)
$5.50 – $13.91 ........................ 784 10.32 1.5 734 10.31 1.4
$14.86 – $19.55 ....................... 1,091 18.23 2.6 797 18.10 2.6
$20.10 – $26.88 ....................... 926 22.90 3.3 359 22.94 3.2
$27.60 – $38.97 ....................... 2,362 31.30 4.2 282 31.43 3.8
5,163 23.85 3.3 2,172 18.00 2.5
Compensation expense for all stock-based plans for the years ended October 31, 2004, 2003 and 2002 is
$3,331, $3,445 and $3,053, respectively.
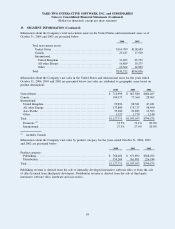
17. RESULTS BY QUARTER (UNAUDITED)
The following tables set forth quarterly supplementary data for each of the years in the two-year period ended
October 31, 2004.
2004
1
st
Quarter
2
nd
Quarter
3
rd
Quarter
4
th
Quarter
Net sales ...................................... $375,512 $153,368 $160,858 $438,013
Gross profit ................................... 127,154 34,206 42,860 173,851
Net income (loss) ............................. $ 31,758 $ (14,576) $ (14,435) $ 62,631
Per share data:
Basic — EPS ............................... $ 0.72 $ (0.33) $ (0.32) $ 1.39
Diluted — EPS ............................. $ 0.70 $ (0.33) $ (0.32) $ 1.36
2003
Net sales ...................................... $411,008 $193,023 $152,055 $277,607
Gross profit ................................... 165,947 71,483 58,519 100,190
Net income ................................... $ 51,535 $ 14,623 $ 5,696 $ 26,264
Per share data:
Basic — EPS ............................... $ 1.26 $ 0.35 $ 0.13 $ 0.60
Diluted — EPS ............................. $ 1.22 $ 0.35 $ 0.13 $ 0.58
TAKE-TWO INTERACTIVE SOFTWARE, INC. and SUBSIDIARIES
Notes to Consolidated Financial Statements (Continued)
(Dollars in thousands, except per share amounts)
16. STOCK-BASED PLANS (Continued)
57