2K Sports 2004 Annual Report Download - page 57
Download and view the complete annual report
Please find page 57 of the 2004 2K Sports annual report below. You can navigate through the pages in the report by either clicking on the pages listed below, or by using the keyword search tool below to find specific information within the annual report.-
 1
1 -
2
-
3
-
4
-
5
-
6
-
7
-
8
-
9
-
10
-
11
-
12
-
13
-
14
-
15
-
16
-
17
-
18
-
19
-
20
-
21
-
22
-
23
-
24
-
25
-
26
-
27
-
28
-
29
-
30
-
31
-
32
-
33
-
34
-
35
-
36
-
37
-
38
-
39
-
40
-
41
-
42
-
43
-
44
-
45
-
46
-
 47
47 -
 48
48 -
 49
49 -
 50
50 -
 51
51 -
 52
52 -
 53
53 -
 54
54 -
 55
55 -
 56
56 -
 57
57 -
 58
58 -
 59
59 -
 60
60 -
 61
61 -
 62
62 -
 63
63 -
 64
64 -
 65
65 -
 66
66 -
 67
67 -
68
-
69
-
70
-
71
-
72
-
73
-
74
-
75
-
76
-
77
-
78
-
79
-
80
 |
 |

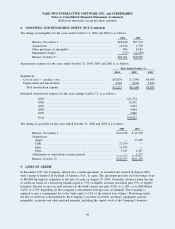
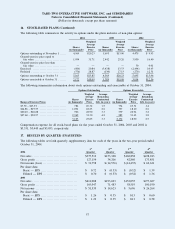
6. FIXED ASSETS, NET
As of October 31, 2004 and 2003, fixed assets consist of:
2004 2003
Computer equipment .............................................. $16,973 $12,963
Office equipment ................................................. 6,405 5,096
Computer software ................................................ 15,480 11,529
Furniture and fixtures ............................................. 4,413 3,157
Leasehold improvements .......................................... 10,906 6,047
Capital leases ..................................................... 398 398
Construction in progress .......................................... 3,922 —
58,497 39,190
Less: accumulated depreciation and amortization ................. 24,206 16,930
Total .............................................................. $34,291 $22,260
Depreciation expense for the years ended October 31, 2004, 2003, and 2002, amounted to $12,443, $9,510
and $6,457, respectively.
7. CAPITALIZED SOFTWARE DEVELOPMENT COSTS
The following table provides the details of capitalized software development costs:
Years Ended October 31,
2004 2003 2002
Balance, November 1 ................................................. $ 16,336 $ 10,385 $ 9,739
Additions ............................................................. 25,960 15,923 9,645
Amortization .......................................................... (12,902) (10,940) (7,633)
Reclassification ....................................................... — — (1,419)
Write down ........................................................... (3,020) (63) (490)
Foreign exchange ..................................................... 1,411 1,031 543
Balance, October 31 .................................................. $ 27,785 $ 16,336 $10,385
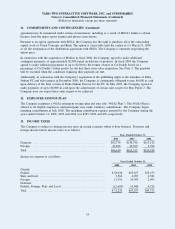
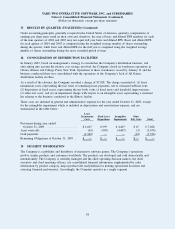
8. GOODWILL AND INTANGIBLE ASSETS, NET
The following table sets forth the components of the intangible assets subject to amortization:
As of October 31, 2004 As of October 31, 2003
Range of
Useful Life
(years)
Gross
Carrying
Amount
Accumulated
Amortization Net
Gross
Carrying
Amount
Accumulated
Amortization Net
Trademarks ................... 7 – 10 $26,825 $(10,438) $16,387 $23,342 $ (7,391) $15,951
Customer lists and
Relationships ............... 5 – 10 4,673 (3,007) 1,666 4,673 (2,733) 1,940
Intellectual property ........... 2 – 6 39,783 (27,151) 12,632 31,823 (8,737) 23,086
Non-competition
Agreements ................ 3 – 6 7,888 (3,002) 4,886 4,790 (2,311) 2,479
Technology ................... 3 4,192 (3,659) 533 4,192 (2,812) 1,380
Total ......................... $83,361 $(47,257) $36,104 $68,820 $(23,984) $44,836
TAKE-TWO INTERACTIVE SOFTWARE, INC. and SUBSIDIARIES
Notes to Consolidated Financial Statements (Continued)
(Dollars in thousands, except per share amounts)
49