Vodafone 2002 Annual Report Download - page 99
Download and view the complete annual report
Please find page 99 of the 2002 Vodafone annual report below. You can navigate through the pages in the report by either clicking on the pages listed below, or by using the keyword search tool below to find specific information within the annual report.-
 1
1 -
2
-
3
-
4
-
5
-
6
-
7
-
8
-
9
-
10
-
11
-
12
-
13
-
14
-
15
-
16
-
17
-
18
-
19
-
20
-
21
-
22
-
23
-
24
-
25
-
26
-
27
-
28
-
29
-
30
-
31
-
32
-
33
-
34
-
35
-
36
-
37
-
38
-
39
-
40
-
41
-
42
-
43
-
44
-
45
-
46
-
47
-
48
-
49
-
50
-
51
-
52
-
53
-
54
-
55
-
56
-
57
-
58
-
59
-
60
-
61
-
62
-
63
-
64
-
65
-
66
-
67
-
68
-
69
-
70
-
71
-
72
-
73
-
74
-
75
-
76
-
77
-
78
-
79
-
80
-
81
-
82
-
83
-
84
-
85
-
86
-
87
-
88
-
 89
89 -
 90
90 -
 91
91 -
 92
92 -
 93
93 -
 94
94 -
 95
95 -
 96
96 -
 97
97 -
 98
98 -
 99
99 -
 100
100 -
 101
101 -
 102
102 -
 103
103 -
 104
104 -
 105
105 -
 106
106 -
 107
107 -
 108
108 -
 109
109 -
110
-
111
-
112
-
113
-
114
-
115
-
116
-
117
-
118
-
119
-
120
-
121
-
122
-
123
-
124
-
125
-
126
-
127
-
128
-
129
-
130
-
131
-
132
-
133
-
134
-
135
-
136
-
137
-
138
-
139
-
140
-
141
-
142
-
143
-
144
-
145
-
146
-
147
-
148
-
149
-
150
-
151
-
152
-
153
-
154
-
155
-
156
 |
 |

Notes to the Consolidated Financial Statements Vodafone Group Plc 97Annual Report & Accounts and Form 20-F
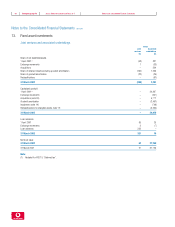
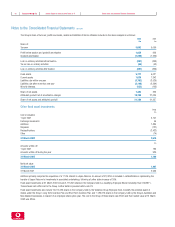
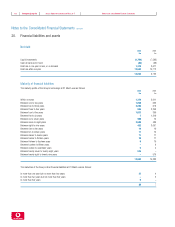
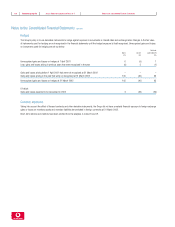
The Company’s fixed asset investments can be analysed as follows:
Subsidiary Joint Associated
undertakings ventures undertakings Total
£m £m £m £m
Cost
1 April 2001 103,562 85 11 103,658
Exchange movements –3(2)1
Additions 18,113 ––18,113
Disposals (14,623) ––(14,623)
Loans to joint ventures –233 –233
31 March 2002 107,052 321 9 107,382
£m £m £m £m
Amounts written off
1 April 2001 ––––
Amounts written off during the year 4,083 ––4,083
31 March 2002 4,083 ––4,083
Net book value
31 March 2002 102,969 321 9 103,299
31 March 2001 103,562 85 11 103,658
Loans to joint ventures and associated undertakings included above amounted to £321m and £9m, respectively, at 31 March 2002 (2001: £85m and £11m).
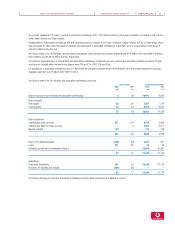
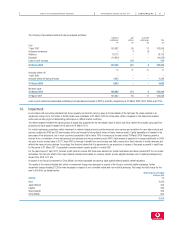
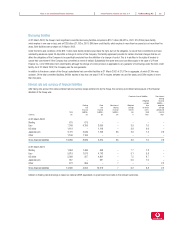
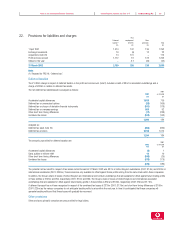
14. Impairment
In accordance with accounting standards the Group regularly monitors the carrying value of its fixed assets. At the half year, the review resulted in an
impairment charge of £4,750 million. A further review was undertaken at 31 March 2002 at a time when certain companies in the telecommunications
sector were showing signs of deteriorating performance in difficult market conditions.
The review assessed whether the carrying value of assets was supported by the net present value of future cash flows derived from assets using cash flow
projections for each asset in respect of the period to 31 March 2011.
For mobile businesses, projections reflect investment in network infrastructure to provide enhanced voice services and a platform for new data products and
services, enabled by GPRS and 3G technologies, which are forecast to be significant drivers of future revenue growth. Capital expenditure is heaviest in the
early years of the projections, but in most countries is expected to fall to below 10% of revenues by the year ended 31 March 2008. Revenue growth is
forecast from a combination of new data products and services and strong underlying voice ARPU. Data revenue is expected to increase significantly to 2006
but grow at more modest rates to 2011. Voice ARPU is forecast to benefit from new services and traffic moving from fixed networks to mobile networks and
reflects the impact of price declines. Accordingly, the directors believe that it is appropriate to use projections in excess of five years as growth in cash flows
for the period to 31 March 2011 is expected to exceed relevant country growth in nominal GDP.
For the years beyond 1 April 2011, forecast growth rates at nominal GDP have been assumed for mobile businesses and below nominal GDP for non-mobile
businesses. The discount rates for the major markets reviewed were based on company specific pre-tax weighted average cost of capital percentages and
ranged from 8.8% to 11.5%.
In respect of the Group’s investment in China Mobile, the review assessed the carrying value against external analyst market valuations.
The results of the review indicated that, whilst no impairment charge was necessary in respect of the Group’s controlled mobile businesses, further
impairment charges totalling £1,250m were necessary in respect of non-controlled mobile and non-mobile businesses. This brings the total charge for the
year to £6,000m, as detailed below.
Total charge for year ended
31 March 2002
Company £m
Arcor 4,000
Japan Telecom 400
Cegetel 250
Grupo Iusacell 450
China Mobile 900
6,000