Vodafone 2002 Annual Report Download - page 86
Download and view the complete annual report
Please find page 86 of the 2002 Vodafone annual report below. You can navigate through the pages in the report by either clicking on the pages listed below, or by using the keyword search tool below to find specific information within the annual report.-
 1
1 -
2
-
3
-
4
-
5
-
6
-
7
-
8
-
9
-
10
-
11
-
12
-
13
-
14
-
15
-
16
-
17
-
18
-
19
-
20
-
21
-
22
-
23
-
24
-
25
-
26
-
27
-
28
-
29
-
30
-
31
-
32
-
33
-
34
-
35
-
36
-
37
-
38
-
39
-
40
-
41
-
42
-
43
-
44
-
45
-
46
-
47
-
48
-
49
-
50
-
51
-
52
-
53
-
54
-
55
-
56
-
57
-
58
-
59
-
60
-
61
-
62
-
63
-
64
-
65
-
66
-
67
-
68
-
69
-
70
-
71
-
72
-
73
-
74
-
75
-
 76
76 -
 77
77 -
 78
78 -
 79
79 -
 80
80 -
 81
81 -
 82
82 -
 83
83 -
 84
84 -
 85
85 -
 86
86 -
 87
87 -
 88
88 -
 89
89 -
 90
90 -
 91
91 -
 92
92 -
 93
93 -
 94
94 -
 95
95 -
 96
96 -
97
-
98
-
99
-
100
-
101
-
102
-
103
-
104
-
105
-
106
-
107
-
108
-
109
-
110
-
111
-
112
-
113
-
114
-
115
-
116
-
117
-
118
-
119
-
120
-
121
-
122
-
123
-
124
-
125
-
126
-
127
-
128
-
129
-
130
-
131
-
132
-
133
-
134
-
135
-
136
-
137
-
138
-
139
-
140
-
141
-
142
-
143
-
144
-
145
-
146
-
147
-
148
-
149
-
150
-
151
-
152
-
153
-
154
-
155
-
156
 |
 |

Vodafone Group Plc Annual Report & Accounts and Form 20-F Notes to the Consolidated Financial Statements84
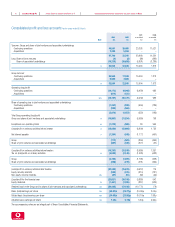
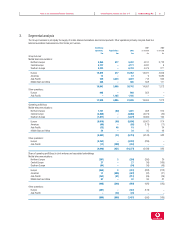
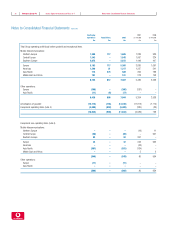
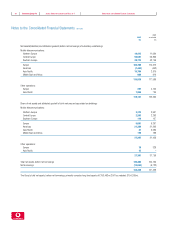
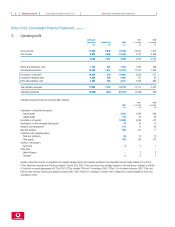
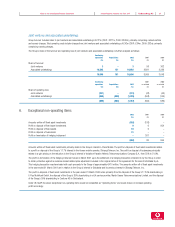
Notes to the Consolidated Financial Statements continued
2001
2002 as restated
£m £m
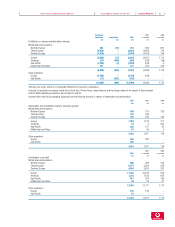
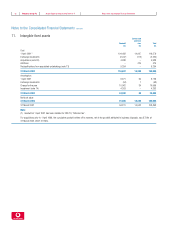
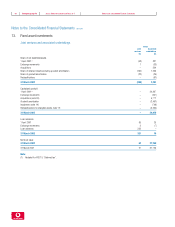
Net assets/(liabilities) and attributed goodwill (before net borrowings) of subsidiary undertakings
Mobile telecommunications:
Northern Europe 10,415 11,684
Central Europe 50,581 59,869
Southern Europe 39,773 42,759
Europe 100,769 114,312
Americas (1,444) (452)
Asia Pacific 15,784 2,810
Middle East and Africa 809 916
115,918 117,586
Other operations:
Europe 287 4,104
Asia Pacific 1,956 704
118,161 122,394
Share of net assets and attributed goodwill of joint ventures and associated undertakings
Mobile telecommunications:
Northern Europe 3,374 3,907
Central Europe 2,203 2,263
Southern Europe 114 127
Europe 5,691 6,297
Americas 21,356 21,363
Asia Pacific 41 3,580
Middle East and Africa 179 188
27,267 31,428
Other operations:
Europe 19 328
Asia Pacific 15 –
27,301 31,756
Total net assets, before net borrowings 145,462 154,150
Net borrowings (12,034) (6,722)
133,428 147,428
The Group’s total net assets, before net borrowings, primarily comprise long-lived assets of £153,462m (2001 as restated: £154,208m).