Vodafone 2002 Annual Report Download - page 28
Download and view the complete annual report
Please find page 28 of the 2002 Vodafone annual report below. You can navigate through the pages in the report by either clicking on the pages listed below, or by using the keyword search tool below to find specific information within the annual report.-
 1
1 -
2
-
3
-
4
-
5
-
6
-
7
-
8
-
9
-
10
-
11
-
12
-
13
-
14
-
15
-
16
-
17
-
 18
18 -
 19
19 -
 20
20 -
 21
21 -
 22
22 -
 23
23 -
 24
24 -
 25
25 -
 26
26 -
 27
27 -
 28
28 -
 29
29 -
 30
30 -
 31
31 -
 32
32 -
 33
33 -
 34
34 -
 35
35 -
 36
36 -
 37
37 -
 38
38 -
39
-
40
-
41
-
42
-
43
-
44
-
45
-
46
-
47
-
48
-
49
-
50
-
51
-
52
-
53
-
54
-
55
-
56
-
57
-
58
-
59
-
60
-
61
-
62
-
63
-
64
-
65
-
66
-
67
-
68
-
69
-
70
-
71
-
72
-
73
-
74
-
75
-
76
-
77
-
78
-
79
-
80
-
81
-
82
-
83
-
84
-
85
-
86
-
87
-
88
-
89
-
90
-
91
-
92
-
93
-
94
-
95
-
96
-
97
-
98
-
99
-
100
-
101
-
102
-
103
-
104
-
105
-
106
-
107
-
108
-
109
-
110
-
111
-
112
-
113
-
114
-
115
-
116
-
117
-
118
-
119
-
120
-
121
-
122
-
123
-
124
-
125
-
126
-
127
-
128
-
129
-
130
-
131
-
132
-
133
-
134
-
135
-
136
-
137
-
138
-
139
-
140
-
141
-
142
-
143
-
144
-
145
-
146
-
147
-
148
-
149
-
150
-
151
-
152
-
153
-
154
-
155
-
156
 |
 |

Vodafone Group Plc Annual Report & Accounts and Form 20-F Information on the Company26
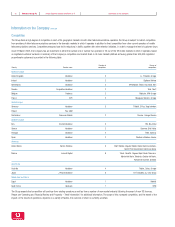
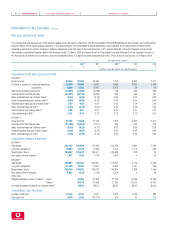
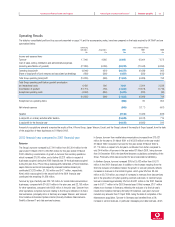
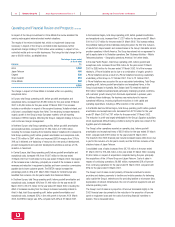
Five year summary of results
The selected financial data set out on the following pages should be read in conjunction with the Consolidated Financial Statements of the Company for the three years
ended 31 March 2002, which appear elsewhere in this Annual Report. The consolidated financial statements of the Company for the year ended 31 March 2002,
prepared in accordance with the Company’s statutory obligations under the laws of the United Kingdom (“UK”), will be delivered to the UK’s Registrar of Companies.
The selected consolidated financial data for the five years ended 31 March 2002 are derived from the Consolidated Financial Statements of the Company included in
this Annual Report. Merely for convenience, amounts represented below in dollars have been translated at $1.425:£1.00, the noon buying rate on 29 March 2002.
Year ended and at 31 March (1)
2002 (2) 2001 2000 (3) 1999 1998
$£ ££££
(in millions, except per ordinary share and ADS amounts)
Consolidated Profit and Loss Account Data
UK GAAP (4)
Group turnover 32,554 22,845 15,004 7,873 3,360 2,471
Of which in respect of: continuing operations 25,564 17,940 6,637 4,498 3,302 2,408
Of which in respect of: acquisitions 6,990 4,905 8,367 3,375 58 63
Total Group operating (loss)/profit (16,863) (11,834) (6,989) 798 963 686
(Loss)/profit for the financial year (23,021) (16,155) (9,885) 542 594 407
Basic (loss)/earnings per ordinary share (5) (0.33) (0.24) (0.16) 0.02 0.04 0.03
Diluted (loss)/earnings per ordinary share (5) (0.34) (0.24) (0.16) 0.02 0.04 0.03
Adjusted basic earnings per ordinary share (5) 0.07 0.05 0.04 0.05 0.04 0.03
Basic (loss)/earnings per ADS (5) (3.39) (2.38) (1.61) 0.20 0.38 0.26
Cash dividends per ordinary share (6) 0.02 0.01 0.01 0.01 0.01 0.01
Cash dividends per ADS (6) 0.21 0.15 0.14 0.13 0.13 0.11
US GAAP (4)
Group turnover 25,136 17,639 11,103 7,873 3,360 2,471
(Loss)/profit for the financial year (23,780) (16,688) (7,071) 553 510 374
Basic (loss)/earnings per ordinary share (5) (0.35) (0.25) (0.12) 0.02 0.03 0.02
Diluted (loss)/earnings per ordinary share (5) (0.35) (0.25) (0.12) 0.02 0.03 0.02
Basic (loss)/earnings per ADS (5) (3.50) (2.46) (1.15) 0.20 0.33 0.24
Consolidated Balance Sheet Data
UK GAAP (4)
Total assets 232,132 162,900 172,390 153,546 3,681 2,584
Long-term obligations 18,693 13,118 11,235 6,374 1,179 685
Shareholders’ funds 186,067 130,573 145,007 140,594 512 23
Non-equity minority interests 1,607 1,128 1,129 1,004 4 23
US GAAP (4)
Total assets 320,887 225,184 236,967 173,347 4,719 4,026
Long-term obligations 21,228 14,897 12,291 6,382 1,187 694
Shareholders’ funds 200,764 140,887 155,522 146,334 1,858 1,440
Non-equity minority interests 1,607 1,128 1,129 1,004 4 23
Other Data
Weighted average number of shares (5) – Basic 67,961 61,439 27,100 15,445 15,365
– Diluted 67,715 61,398 27,360 15,510 15,410
US dollar equivalent dividends per ordinary share(6) $0.02 $0.02 $0.02 $0.02 $0.02
Consolidated Cash Flow Data
Operating cash flow 11,545 8,102 4,587 2,510 1,045 886
Free cash flow 3,370 2,365 (13,278) 276 22 173
Information on the Company continued