Vodafone 2002 Annual Report Download - page 79
Download and view the complete annual report
Please find page 79 of the 2002 Vodafone annual report below. You can navigate through the pages in the report by either clicking on the pages listed below, or by using the keyword search tool below to find specific information within the annual report.-
 1
1 -
2
-
3
-
4
-
5
-
6
-
7
-
8
-
9
-
10
-
11
-
12
-
13
-
14
-
15
-
16
-
17
-
18
-
19
-
20
-
21
-
22
-
23
-
24
-
25
-
26
-
27
-
28
-
29
-
30
-
31
-
32
-
33
-
34
-
35
-
36
-
37
-
38
-
39
-
40
-
41
-
42
-
43
-
44
-
45
-
46
-
47
-
48
-
49
-
50
-
51
-
52
-
53
-
54
-
55
-
56
-
57
-
58
-
59
-
60
-
61
-
62
-
63
-
64
-
65
-
66
-
67
-
68
-
 69
69 -
 70
70 -
 71
71 -
 72
72 -
 73
73 -
 74
74 -
 75
75 -
 76
76 -
 77
77 -
 78
78 -
 79
79 -
 80
80 -
 81
81 -
 82
82 -
 83
83 -
 84
84 -
 85
85 -
 86
86 -
 87
87 -
 88
88 -
 89
89 -
90
-
91
-
92
-
93
-
94
-
95
-
96
-
97
-
98
-
99
-
100
-
101
-
102
-
103
-
104
-
105
-
106
-
107
-
108
-
109
-
110
-
111
-
112
-
113
-
114
-
115
-
116
-
117
-
118
-
119
-
120
-
121
-
122
-
123
-
124
-
125
-
126
-
127
-
128
-
129
-
130
-
131
-
132
-
133
-
134
-
135
-
136
-
137
-
138
-
139
-
140
-
141
-
142
-
143
-
144
-
145
-
146
-
147
-
148
-
149
-
150
-
151
-
152
-
153
-
154
-
155
-
156
 |
 |

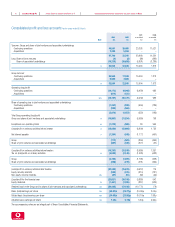
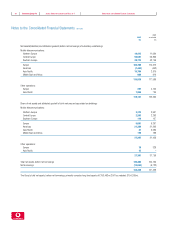
Consolidated statements of total recognised gains and losses for the years ended 31 March Vodafone Group Plc 77Annual Report & Accounts and Form 20-F
2001 2000
2002 2002 as restated as restated
$m £m £m £m
(Loss)/profit for the financial year
Group (20,137) (14,131) (8,730) 982
Share of joint ventures (301) (211) (32) 14
Share of associated undertakings (2,583) (1,813) (1,123) (454)
(23,021) (16,155) (9,885) 542
Currency translation
Group (2,822) (1,980) 2,724 (346)
Share of joint ventures 6445 (35)
Share of associated undertakings (409) (287) 2,403 (740)
(3,225) (2,263) 5,172 (1,121)
Total recognised gains and losses relating to the year (26,246) (18,418) (4,713) (579)
Prior period restatement for FRS 19 (550) (386)
Total gains and losses since last annual report (26,796) (18,804)
Consolidated statements of total recognised gains and losses for the years ended 31 March
Movements in equity shareholders’ funds for the years ended 31 March
2001 2000
2002 2002 as restated as restated
$m £m £m £m
(Loss)/profit for the financial year (23,021) (16,155) (9,885) 542
Equity dividends (1,460) (1,025) (887) (620)
(24,481) (17,180) (10,772) (78)
Currency translation (3,225) (2,263) 5,172 (1,121)
New share capital subscribed, net of issue costs 8,527 5,984 8,972 140,037
Unvested option consideration ––– 1,165
Goodwill transferred to the profit and loss account in respect of business disposals 43118
Scrip dividends ––67 81
Shares to be issued (1,393) (978) 978 –
Other ––(5) (20)
Net movement in equity shareholders’ funds (20,568) (14,434) 4,413 140,082
Opening equity shareholders’ funds 206,635 145,007 140,594 512
Closing equity shareholders’ funds 186,067 130,573 145,007 140,594
The accompanying notes are an integral part of these Consolidated Financial Statements.