Vodafone 2002 Annual Report Download - page 77
Download and view the complete annual report
Please find page 77 of the 2002 Vodafone annual report below. You can navigate through the pages in the report by either clicking on the pages listed below, or by using the keyword search tool below to find specific information within the annual report.-
 1
1 -
2
-
3
-
4
-
5
-
6
-
7
-
8
-
9
-
10
-
11
-
12
-
13
-
14
-
15
-
16
-
17
-
18
-
19
-
20
-
21
-
22
-
23
-
24
-
25
-
26
-
27
-
28
-
29
-
30
-
31
-
32
-
33
-
34
-
35
-
36
-
37
-
38
-
39
-
40
-
41
-
42
-
43
-
44
-
45
-
46
-
47
-
48
-
49
-
50
-
51
-
52
-
53
-
54
-
55
-
56
-
57
-
58
-
59
-
60
-
61
-
62
-
63
-
64
-
65
-
66
-
 67
67 -
 68
68 -
 69
69 -
 70
70 -
 71
71 -
 72
72 -
 73
73 -
 74
74 -
 75
75 -
 76
76 -
 77
77 -
 78
78 -
 79
79 -
 80
80 -
 81
81 -
 82
82 -
 83
83 -
 84
84 -
 85
85 -
 86
86 -
 87
87 -
88
-
89
-
90
-
91
-
92
-
93
-
94
-
95
-
96
-
97
-
98
-
99
-
100
-
101
-
102
-
103
-
104
-
105
-
106
-
107
-
108
-
109
-
110
-
111
-
112
-
113
-
114
-
115
-
116
-
117
-
118
-
119
-
120
-
121
-
122
-
123
-
124
-
125
-
126
-
127
-
128
-
129
-
130
-
131
-
132
-
133
-
134
-
135
-
136
-
137
-
138
-
139
-
140
-
141
-
142
-
143
-
144
-
145
-
146
-
147
-
148
-
149
-
150
-
151
-
152
-
153
-
154
-
155
-
156
 |
 |

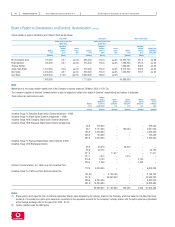
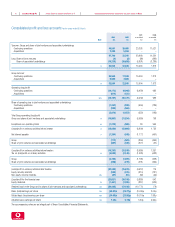
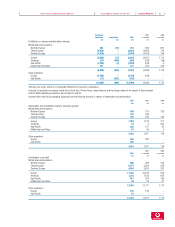
Balance sheets at 31 March Vodafone Group Plc 75Annual Report & Accounts and Form 20-F
Group Company
2001
2002 2002 as restated 2002 2001
Note $m £m £m £m £m
Fixed assets
Intangible assets 11 150,970 105,944 108,853 ––
Tangible assets 12 26,421 18,541 10,586 ––
Investments 41,292 28,977 34,769 103,299 103,658
Investments in joint ventures:
Loans to joint ventures 13 457 321 85 321 85
Investments in associated undertakings 13 38,830 27,249 31,729 911
Other investments 13 2,005 1,407 2,955 102,969 103,562
218,683 153,462 154,208 103,299 103,658
Current assets
Stocks 15 731 513 316 ––
Debtors 16 10,051 7,053 4,587 33,190 24,180
Investments 17 2,553 1,792 13,211 ––
Cash at bank and in hand 114 80 68 –4
13,449 9,438 18,182 33,190 24,184
Creditors: amounts falling due within one year 18 (19,173) (13,455) (12,377) (70,073) (65,843)
Net current (liabilities)/assets (5,724) (4,017) 5,805 (36,883) (41,659)
Total assets less current liabilities 212,959 149,445 160,013 66,416 61,999
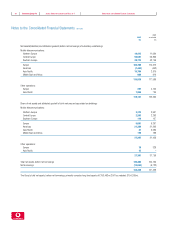
Creditors: amounts falling due after more than one year 19 (18,693) (13,118) (11,235) (5,725) (5,263)
Provisions for liabilities and charges (4,131) (2,899) (1,350) ––
Investments in joint ventures:
Share of gross assets 108 76 88 ––
Share of gross liabilities (492) (345) (146) ––
13 (384) (269) (58) ––
Other provisions 22 (3,747) (2,630) (1,292) ––
190,135 133,428 147,428 60,691 56,736
Capital and reserves
Called up share capital 23 6,089 4,273 4,054 4,273 4,054
Share premium account 24 74,163 52,044 48,292 52,044 48,292
Merger reserve 24 140,971 98,927 96,914 ––
Capital reserve –––88 88
Other reserve 24 1,332 935 1,024 935 1,024
Profit and loss account 24 (36,488) (25,606) (6,255) 3,351 2,300
Shares to be issued 24 ––978 –978
Total equity shareholders’ funds 186,067 130,573 145,007 60,691 56,736
Equity minority interests 2,461 1,727 1,292 ––
Non-equity minority interests 25 1,607 1,128 1,129 ––
190,135 133,428 147,428 60,691 56,736
The financial statements on pages 74 to 140 were approved by the Board of Directors on 27 May 2002 and were signed on its behalf by:
SIR CHRISTOPHER GENT Chief Executive
K J HYDON Financial Director
The accompanying notes are an integral part of these Consolidated Financial Statements.
Balance sheets at 31 March