Vodafone 2002 Annual Report Download - page 87
Download and view the complete annual report
Please find page 87 of the 2002 Vodafone annual report below. You can navigate through the pages in the report by either clicking on the pages listed below, or by using the keyword search tool below to find specific information within the annual report.-
 1
1 -
2
-
3
-
4
-
5
-
6
-
7
-
8
-
9
-
10
-
11
-
12
-
13
-
14
-
15
-
16
-
17
-
18
-
19
-
20
-
21
-
22
-
23
-
24
-
25
-
26
-
27
-
28
-
29
-
30
-
31
-
32
-
33
-
34
-
35
-
36
-
37
-
38
-
39
-
40
-
41
-
42
-
43
-
44
-
45
-
46
-
47
-
48
-
49
-
50
-
51
-
52
-
53
-
54
-
55
-
56
-
57
-
58
-
59
-
60
-
61
-
62
-
63
-
64
-
65
-
66
-
67
-
68
-
69
-
70
-
71
-
72
-
73
-
74
-
75
-
76
-
 77
77 -
 78
78 -
 79
79 -
 80
80 -
 81
81 -
 82
82 -
 83
83 -
 84
84 -
 85
85 -
 86
86 -
 87
87 -
 88
88 -
 89
89 -
 90
90 -
 91
91 -
 92
92 -
 93
93 -
 94
94 -
 95
95 -
 96
96 -
 97
97 -
98
-
99
-
100
-
101
-
102
-
103
-
104
-
105
-
106
-
107
-
108
-
109
-
110
-
111
-
112
-
113
-
114
-
115
-
116
-
117
-
118
-
119
-
120
-
121
-
122
-
123
-
124
-
125
-
126
-
127
-
128
-
129
-
130
-
131
-
132
-
133
-
134
-
135
-
136
-
137
-
138
-
139
-
140
-
141
-
142
-
143
-
144
-
145
-
146
-
147
-
148
-
149
-
150
-
151
-
152
-
153
-
154
-
155
-
156
 |
 |

Notes to the Consolidated Financial Statements Vodafone Group Plc 85Annual Report & Accounts and Form 20-F
2002 2001 2000
£m £m £m
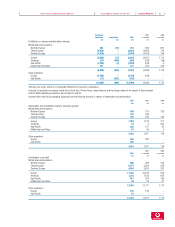
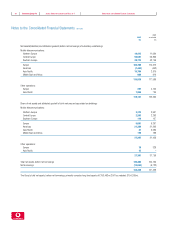
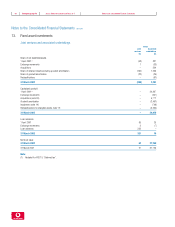
Capital expenditure on intangible and tangible fixed assets (excluding goodwill)
Mobile telecommunications:
Northern Europe 925 7,529 807
Central Europe 1,028 6,200 –
Southern Europe 1,695 2,552 622
Europe 3,648 16,281 1,429
Americas 23 67 587
Asia Pacific 826 366 256
Middle East and Africa 152 174 41
4,649 16,888 2,313
Other operations:
Europe 214 380 –
Asia Pacific 255 ––
5,118 17,268 2,313
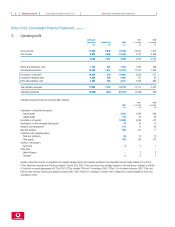
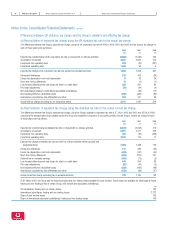
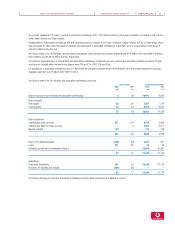
4. Exceptional operating items
2002 2001 2000
£m £m £m
Impairment of intangible and tangible fixed assets 5,100 91 –
Reorganisation costs 86 85 30
Share of exceptional operating items of associated undertakings and joint ventures 222 141 –
Other items –3 –
5,408 320 30
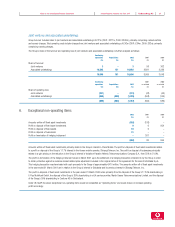
The impairment charges of £5,100 million primarily relate to the carrying value of goodwill for Arcor, Cegetel, Grupo Iusacell and Japan Telecom.
Reorganisation costs of £86 million relate to the Group’s operations in Australia and the UK. The Group’s share of exceptional items of its associated
undertakings and joint ventures of £222 million, comprise £102 million of, principally, asset write-downs in J-Phone Vodafone and £115 million of
reorganisation costs in Verizon Wireless and Vizzavi.
Exceptional operating items for 2001 of £320 million primarily comprise impairment charges of £91 million in relation to the carrying value of certain assets
within the Group’s Globalstar service provider businesses, £85 million of reorganisation costs relating to the Group’s operations in Germany and the US, and
£141 million in relation to the Group’s share of restructuring costs incurred by Verizon Wireless.