Vodafone 2002 Annual Report Download - page 5
Download and view the complete annual report
Please find page 5 of the 2002 Vodafone annual report below. You can navigate through the pages in the report by either clicking on the pages listed below, or by using the keyword search tool below to find specific information within the annual report.-
 1
1 -
 2
2 -
 3
3 -
 4
4 -
 5
5 -
 6
6 -
 7
7 -
 8
8 -
 9
9 -
 10
10 -
 11
11 -
 12
12 -
 13
13 -
 14
14 -
 15
15 -
 16
16 -
17
-
18
-
19
-
20
-
21
-
22
-
23
-
24
-
25
-
26
-
27
-
28
-
29
-
30
-
31
-
32
-
33
-
34
-
35
-
36
-
37
-
38
-
39
-
40
-
41
-
42
-
43
-
44
-
45
-
46
-
47
-
48
-
49
-
50
-
51
-
52
-
53
-
54
-
55
-
56
-
57
-
58
-
59
-
60
-
61
-
62
-
63
-
64
-
65
-
66
-
67
-
68
-
69
-
70
-
71
-
72
-
73
-
74
-
75
-
76
-
77
-
78
-
79
-
80
-
81
-
82
-
83
-
84
-
85
-
86
-
87
-
88
-
89
-
90
-
91
-
92
-
93
-
94
-
95
-
96
-
97
-
98
-
99
-
100
-
101
-
102
-
103
-
104
-
105
-
106
-
107
-
108
-
109
-
110
-
111
-
112
-
113
-
114
-
115
-
116
-
117
-
118
-
119
-
120
-
121
-
122
-
123
-
124
-
125
-
126
-
127
-
128
-
129
-
130
-
131
-
132
-
133
-
134
-
135
-
136
-
137
-
138
-
139
-
140
-
141
-
142
-
143
-
144
-
145
-
146
-
147
-
148
-
149
-
150
-
151
-
152
-
153
-
154
-
155
-
156
 |
 |

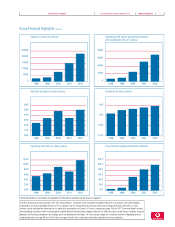
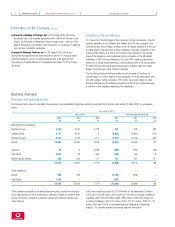
Group Financial Highlights Vodafone Group Plc 3Annual Report & Accounts and Form 20-F
Group Financial Highlights continued
0
5000
10000
15000
20000
25000
20022001200019991998
Statutory turnover (£ millions)
0.0
20.0
40.0
60.0
80.0
100.0
120.0
20022001200019991998
Proportionate registered customers (millions)
0.00
1.00
2.00
3.00
4.00
5.00
6.00
20022001200019991998
Adjusted earnings per share (pence)
0.00
2.00
4.00
6.00
8.00
10.00
12.00
20022001200019991998
Operating cash flow per share (pence)
0
2000
4000
6000
8000
20022001200019991998
Operating profit before goodwill amortisation
and exceptional items (£ millions)
0.00
0.50
1.00
1.50
20022001200019991998
Dividends per share (pence)
This Annual Report & Accounts and Form 20-F (the “Annual Report”), constitutes the Annual Report of Vodafone Group Plc in accordance with United Kingdom
requirements and its Annual Report on Form 20-F in accordance with the requirements of the US Securities and Exchange Commission (the “SEC”). A cross-
reference guide setting out the information in this report that corresponds to the Form 20-F items is provided on pages 150 and 151. This Annual Report contains
forward-looking statements within the meaning of the United States Private Securities Litigation Reform Act of 1995 with respect to the Group’s condition, results of
operation and business management and strategy, plans and objectives for the Group. For further details, please see “Cautionary Statement Regarding Forward
Looking Statements”on page 28 and “Risk Factors”on pages 29 and 30 for a discussion of the risks associated with these statements.
Further information on the basis of preparation of the above numbers can be found on page 27.