Vodafone 2002 Annual Report Download - page 7
Download and view the complete annual report
Please find page 7 of the 2002 Vodafone annual report below. You can navigate through the pages in the report by either clicking on the pages listed below, or by using the keyword search tool below to find specific information within the annual report.
Vodafone Group Plc
Annual Report & Accounts and Form 20-FChief Executive’s Statement 5
Chief Executive’s Statement
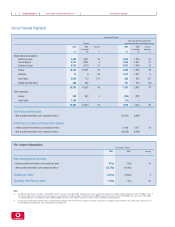
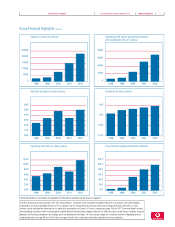
Group turnover was up 52% on last year at £22.8
billion and profit before tax, goodwill and exceptional
items was up 35% at £7.0 billion. Adjusted earnings
per share, before goodwill and exceptional items,
of 5.15 pence was up 45% and is now at a higher
level than before the Mannesmann acquisition,
ahead of the expectations we had at that time.
Free cash flow, after paying for licences, of £2.4
billion and Group net debt at 31 March of £12.0
billion were both better than our expectations and
demonstrate good control of capital expenditure and
an excellent working capital performance from the
operating companies.
The Group’s proportionate EBITDA margin before
exceptional items for the mobile businesses was
36% and total proportionate EBITDA margin,
including fixed wire and exceptional costs, was
33%, both up 3 percentage points on last year.
These improvements arise from the successful
implementation of new commercial policies, better
overhead management across most of the businesses
in the Group and lower exceptional costs.
With respect to business operations, we have seen
stability in average revenue per user (ARPU) during
the year in most markets and satisfactory customer
growth with a better mix of the customer base in
most markets.
Data revenues rose by 87% to £2.1 billion,
representing 11% of service revenues for the year
as a whole, up 3 percentage points. For the month
of March 2002, data contributed 13% of service
revenues, up 4 percentage points from March 2001.
Vodafone gained control of J-Phone Vodafone in
October 2001 and it was pleasing that it achieved
its highest ever market share in Japan for the
remainder of the year, moving into second place
in the Japanese market by the end of March. Also,
during the last year 4 million J-Phone Vodafone
customers, equivalent to one third of its customer
base, have bought camera phones. The rapid
adoption rate of the Sha-mail picture messaging
service has made it the fastest growing new
application yet seen in mobile telecommunications,
considerably outperforming SMS.
We have always seen this coming financial year
as a key transition year in the move from continued
revenue growth arising from new customer
additions, to enhanced revenue growth, primarily
from additional customer usage.
We envisage net customer growth next year of just
under 10%, allowing for the continuing need to
disconnect registered SIMs that are non-revenue
generating. At the same time we expect an
improvement in the customer mix through continued
growth in contract customers, arising in part through
competitive gain.
In addition to customer growth, we expect a modest
but real improvement in ARPU in most of our major
European markets despite reductions in incoming
call termination charges and a planned reduction
in international roaming tariffs to enhance our
competitive position.
The improvement in revenue should arise from
several different sources but primarily from the
continuing increase in data revenues from new
applications, such as picture messaging, the much
greater usage of new voice services introduced last
year, competitive gain of high spending customers
and a further increase in active customers in our
registered base.
The combination of customer growth and the
envisaged growth in ARPU should lead to double-
digit revenue growth. In addition, we will continue
our focus on improved operational performance and
expect to achieve further improvements in EBITDA
margin. Together, this will generate still better
operating cash flow in the year ahead.
On free cash flow, we expect continued good control
of capital expenditure, achieving an efficiency ratio
(capital expenditure to sales) of approximately 20%,
even with much greater expenditure on 3G this year
than last, as a prelude to the opening of 3G
services. Though we expect to increase capital
expenditure by just under £2 billion on this year’s
figure, we envisage generating similar free cash flow
this year as we did last year.
Our focus is selling more products to more of our
This year has seen the Group execute successfully the adjustments
to our strategy, announced last year, to deliver very strong operational
performance and excellent financial results.
Sir Christopher Gent
Chief Executive

