Vodafone 2002 Annual Report Download - page 83
Download and view the complete annual report
Please find page 83 of the 2002 Vodafone annual report below. You can navigate through the pages in the report by either clicking on the pages listed below, or by using the keyword search tool below to find specific information within the annual report.-
 1
1 -
2
-
3
-
4
-
5
-
6
-
7
-
8
-
9
-
10
-
11
-
12
-
13
-
14
-
15
-
16
-
17
-
18
-
19
-
20
-
21
-
22
-
23
-
24
-
25
-
26
-
27
-
28
-
29
-
30
-
31
-
32
-
33
-
34
-
35
-
36
-
37
-
38
-
39
-
40
-
41
-
42
-
43
-
44
-
45
-
46
-
47
-
48
-
49
-
50
-
51
-
52
-
53
-
54
-
55
-
56
-
57
-
58
-
59
-
60
-
61
-
62
-
63
-
64
-
65
-
66
-
67
-
68
-
69
-
70
-
71
-
72
-
 73
73 -
 74
74 -
 75
75 -
 76
76 -
 77
77 -
 78
78 -
 79
79 -
 80
80 -
 81
81 -
 82
82 -
 83
83 -
 84
84 -
 85
85 -
 86
86 -
 87
87 -
 88
88 -
 89
89 -
 90
90 -
 91
91 -
 92
92 -
 93
93 -
94
-
95
-
96
-
97
-
98
-
99
-
100
-
101
-
102
-
103
-
104
-
105
-
106
-
107
-
108
-
109
-
110
-
111
-
112
-
113
-
114
-
115
-
116
-
117
-
118
-
119
-
120
-
121
-
122
-
123
-
124
-
125
-
126
-
127
-
128
-
129
-
130
-
131
-
132
-
133
-
134
-
135
-
136
-
137
-
138
-
139
-
140
-
141
-
142
-
143
-
144
-
145
-
146
-
147
-
148
-
149
-
150
-
151
-
152
-
153
-
154
-
155
-
156
 |
 |

Notes to the Consolidated Financial Statements Vodafone Group Plc 81Annual Report & Accounts and Form 20-F
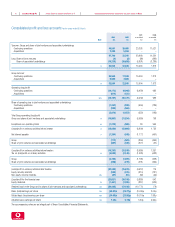
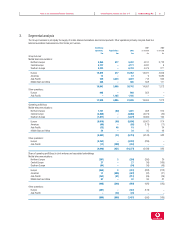
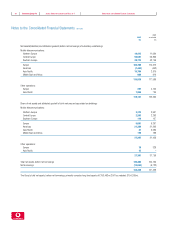
3. Segmental analysis
The Group’s business is principally the supply of mobile telecommunications services and products. Other operations primarily comprise fixed line
telecommunications businesses and the Vizzavi joint venture.
Continuing 2001 2000
operations Acquisitions 2002 as restated as restated
£m £m £m £m £m
Group turnover
Mobile telecommunications:
Northern Europe 4,955 477 5,432 4,511 3,723
Central Europe 4,177 – 4,177 4,031 6
Southern Europe 6,743 – 6,743 4,479 877
Europe 15,875 477 16,352 13,021 4,606
Americas 12 –12 9 2,585
Asia Pacific 749 3,323 4,072 713 565
Middle East and Africa 306 –306 308 117
16,942 3,800 20,742 14,051 7,873
Other operations:
Europe 998 –998 953 –
Asia Pacific – 1,105 1,105 ––
17,940 4,905 22,845 15,004 7,873
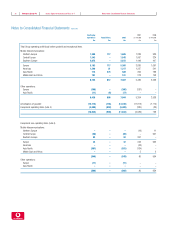
Operating profit/(loss)
Mobile telecommunications:
Northern Europe 1,121 (80) 1,041 968 810
Central Europe (4,860) – (4,860) (4,975) (30)
Southern Europe (1,877) – (1,877) (2,060) 194
Europe (5,616) (80) (5,696) (6,067) 974
Americas (68) –(68) (179) (71)
Asia Pacific (33) 48 15 734
Middle East and Africa 34 –34 95 46
(5,683) (32) (5,715) (6,144) 983
Other operations:
Europe (4,252) – (4,252) (295) –
Asia Pacific (11) (399) (410) ––
(9,946) (431) (10,377) (6,439) 983
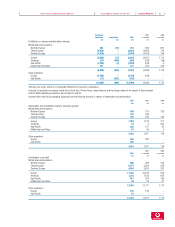
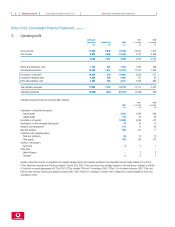
Share of operating profit/(loss) in joint ventures and associated undertakings
Mobile telecommunications:
Northern Europe (287) 3 (284) (350) 20
Central Europe 27 –27 (16) (185)
Southern Europe (94) –(94) (16) (48)
Europe (354) 3 (351) (382) (213)
Americas 11 (498) (487) (31) (27)
Asia Pacific (162) (51) (213) (99) (26)
Middle East and Africa 97 –97 86 81
(408) (546) (954) (426) (185)
Other operations:
Europe (481) –(481) (124) –
Asia Pacific –(22) (22) ––
(889) (568) (1,457) (550) (185)