TCF Bank 2001 Annual Report Download - page 74
Download and view the complete annual report
Please find page 74 of the 2001 TCF Bank annual report below. You can navigate through the pages in the report by either clicking on the pages listed below, or by using the keyword search tool below to find specific information within the annual report.-
 1
1 -
2
-
3
-
4
-
5
-
6
-
7
-
8
-
9
-
10
-
11
-
12
-
13
-
14
-
15
-
16
-
17
-
18
-
19
-
20
-
21
-
22
-
23
-
24
-
25
-
26
-
27
-
28
-
29
-
30
-
31
-
32
-
33
-
34
-
35
-
36
-
37
-
38
-
39
-
40
-
41
-
42
-
43
-
44
-
45
-
46
-
47
-
48
-
49
-
50
-
51
-
52
-
53
-
54
-
55
-
56
-
57
-
58
-
59
-
60
-
61
-
62
-
63
-
 64
64 -
 65
65 -
 66
66 -
 67
67 -
 68
68 -
 69
69 -
 70
70 -
 71
71 -
 72
72 -
 73
73 -
 74
74 -
 75
75 -
 76
76 -
 77
77 -
 78
78 -
 79
79 -
 80
80 -
 81
81 -
 82
82
 |
 |
72
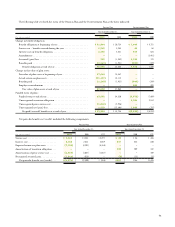
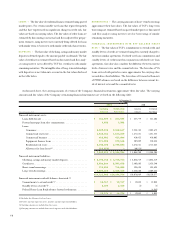
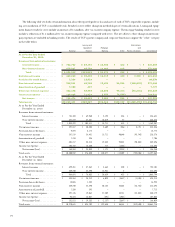
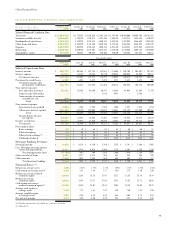
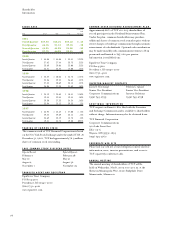
CONDENSED STATEMENTS OF INCOME
Year Ended December 31,
(In thousands) 2001 2000 1999
Interest income . . . . . . . . . . . . . . . . . . . . . . . . . . . . . . . . . . . . . . . . . . . . . . . . . . . . $ 833 $ 1,192 $ 576
Interest expense . . . . . . . . . . . . . . . . . . . . . . . . . . . . . . . . . . . . . . . . . . . . . . . . . . . . 376 1,726 4,000
Net interest income (expense) . . . . . . . . . . . . . . . . . . . . . . . . . . . . . . . . . . . . . . . 457 (534) (3,424)
Cash dividends received from consolidated bank subsidiaries . . . . . . . . . . . . . . . . . . . . 206,970 212,327 164,791
Other non-interest income:
Affiliate service fees . . . . . . . . . . . . . . . . . . . . . . . . . . . . . . . . . . . . . . . . . . . . . . . 14,292 90,553 82,567
Other . . . . . . . . . . . . . . . . . . . . . . . . . . . . . . . . . . . . . . . . . . . . . . . . . . . . . . . . . 95 87 (3)
Total other non-interest income . . . . . . . . . . . . . . . . . . . . . . . . . . . . . . . . . . . 14,387 90,640 82,564
Non-interest expense:
Compensation and employee benefits . . . . . . . . . . . . . . . . . . . . . . . . . . . . . . . . . . 13,785 54,506 49,171
Occupancy and equipment . . . . . . . . . . . . . . . . . . . . . . . . . . . . . . . . . . . . . . . . . . 784 16,133 14,982
Other . . . . . . . . . . . . . . . . . . . . . . . . . . . . . . . . . . . . . . . . . . . . . . . . . . . . . . . . . 1,690 22,970 20,622
Total non-interest expense . . . . . . . . . . . . . . . . . . . . . . . . . . . . . . . . . . . . . . . 16,259 93,609 84,775
Income before income tax benefit and equity in undistributed
earnings of subsidiaries . . . . . . . . . . . . . . . . . . . . . . . . . . . . . . . . . . . . . . . . . . 205,555 208,824 159,156
Income tax benefit . . . . . . . . . . . . . . . . . . . . . . . . . . . . . . . . . . . . . . . . . . . . . . . . . . 496 1,435 1,852
Income before equity in undistributed earnings of subsidiaries . . . . . . . . . . . . . . . . 206,051 210,259 161,008
Equity in undistributed earnings of subsidiaries . . . . . . . . . . . . . . . . . . . . . . . . . . . . . 1,271 (24,014) 5,031
Net income . . . . . . . . . . . . . . . . . . . . . . . . . . . . . . . . . . . . . . . . . . . . . . . . . . . . . . . $207,322 $186,245 $166,039
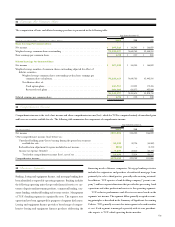
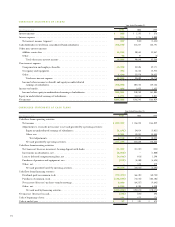
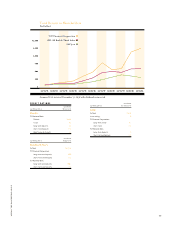
CONDENSED STATEMENTS OF CASH FLOWS
Year Ended December 31,
(In thousands) 2001 2000 1999
Cash flows from operating activities:
Net income . . . . . . . . . . . . . . . . . . . . . . . . . . . . . . . . . . . . . . . . . . . . . . . . . . . . $ 207,322 $ 186,245 $ 166,039
Adjustments to reconcile net income to net cash provided by operating activities:
Equity in undistributed earnings of subsidiaries. . . . . . . . . . . . . . . . . . . . . . . . (1,271) 24,014 (5,031)
Other, net . . . . . . . . . . . . . . . . . . . . . . . . . . . . . . . . . . . . . . . . . . . . . . . . . . 5,381 13,381 15,554
Total adjustments . . . . . . . . . . . . . . . . . . . . . . . . . . . . . . . . . . . . . . . . . . . 4,110 37,395 10,523
Net cash provided by operating activities . . . . . . . . . . . . . . . . . . . . . . . . . . . . . 211,432 223,640 176,562
Cash flows from investing activities:
Net (increase) decrease in interest-bearing deposits with banks . . . . . . . . . . . . . . . 21,339 (21,357) (238)
Investments in subsidiaries, net . . . . . . . . . . . . . . . . . . . . . . . . . . . . . . . . . . . . . . (6,000) – (1,000)
Loan to deferred compensation plans, net . . . . . . . . . . . . . . . . . . . . . . . . . . . . . . (4,646) (416) 1,390
Purchases of premises and equipment, net . . . . . . . . . . . . . . . . . . . . . . . . . . . . . . (273) (4,300) (6,624)
Other, net . . . . . . . . . . . . . . . . . . . . . . . . . . . . . . . . . . . . . . . . . . . . . . . . . . . . . –525 579
Net cash provided (used) by investing activities. . . . . . . . . . . . . . . . . . . . . . . . . 10,420 (25,548) (5,893)
Cash flows from financing activities:
Dividends paid on common stock . . . . . . . . . . . . . . . . . . . . . . . . . . . . . . . . . . . . (77,473) (66,101) (60,755)
Purchases of common stock. . . . . . . . . . . . . . . . . . . . . . . . . . . . . . . . . . . . . . . . . (148,043) (73,824) (106,106)
Net increase (decrease) in short-term borrowings . . . . . . . . . . . . . . . . . . . . . . . . . 2,000 (64,357) (9,643)
Other, net . . . . . . . . . . . . . . . . . . . . . . . . . . . . . . . . . . . . . . . . . . . . . . . . . . . . . 1,510 5,708 6,330
Net cash used by financing activities . . . . . . . . . . . . . . . . . . . . . . . . . . . . . . . . (222,006) (198,574) (170,174)
Net increase (decrease) in cash . . . . . . . . . . . . . . . . . . . . . . . . . . . . . . . . . . . . . . . . . (154) (482) 495
Cash at beginning of year . . . . . . . . . . . . . . . . . . . . . . . . . . . . . . . . . . . . . . . . . . . . . 191 673 178
Cash at end of year . . . . . . . . . . . . . . . . . . . . . . . . . . . . . . . . . . . . . . . . . . . . . . . . . $ 37 $ 191 $ 673