TCF Bank 2001 Annual Report Download - page 50
Download and view the complete annual report
Please find page 50 of the 2001 TCF Bank annual report below. You can navigate through the pages in the report by either clicking on the pages listed below, or by using the keyword search tool below to find specific information within the annual report.-
 1
1 -
2
-
3
-
4
-
5
-
6
-
7
-
8
-
9
-
10
-
11
-
12
-
13
-
14
-
15
-
16
-
17
-
18
-
19
-
20
-
21
-
22
-
23
-
24
-
25
-
26
-
27
-
28
-
29
-
30
-
31
-
32
-
33
-
34
-
35
-
36
-
37
-
38
-
39
-
 40
40 -
 41
41 -
 42
42 -
 43
43 -
 44
44 -
 45
45 -
 46
46 -
 47
47 -
 48
48 -
 49
49 -
 50
50 -
 51
51 -
 52
52 -
 53
53 -
 54
54 -
 55
55 -
 56
56 -
 57
57 -
 58
58 -
 59
59 -
 60
60 -
61
-
62
-
63
-
64
-
65
-
66
-
67
-
68
-
69
-
70
-
71
-
72
-
73
-
74
-
75
-
76
-
77
-
78
-
79
-
80
-
81
-
82
 |
 |
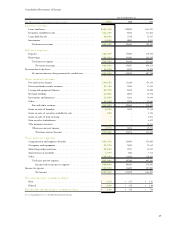
48
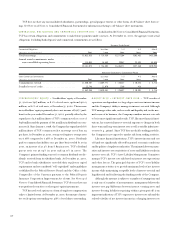
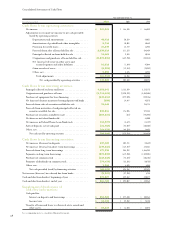
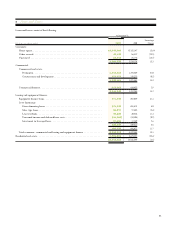
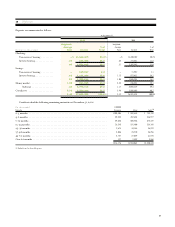
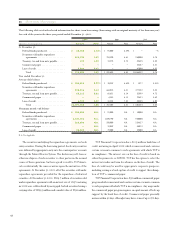
Consolidated Statements of Cash Flows
Year Ended December 31,
(In thousands) 2001 2000 1999
Cash flows from operating activities:
Net income . . . . . . . . . . . . . . . . . . . . . . . . . . . . . . . . . . . . $ 207,322 $ 186,245 $ 166,039
Adjustments to reconcile net income to net cash provided
(used) by operating activities:
Depreciation and amortization . . . . . . . . . . . . . . . . . 42,412 30,369 29,031
Amortization of goodwill and other intangibles . . . . . 9,716 10,001 10,689
Provision for credit losses . . . . . . . . . . . . . . . . . . . . . 20,878 14,772 16,923
Proceeds from sales of loans held for sale . . . . . . . . . . 2,135,218 611,123 586,859
Principal collected on loans held for sale . . . . . . . . . . 12,469 9,885 10,144
Originations and purchases of loans held for sale . . . . (2,375,396) (649,750) (457,515)
Net (increase) decrease in other assets and
accrued expenses and other liabilities . . . . . . . . . . 91,612 (1,854) 47,088
Gains on sales of assets . . . . . . . . . . . . . . . . . . . . . . . (4,393) (12,813) (23,952)
Other, net . . . . . . . . . . . . . . . . . . . . . . . . . . . . . . . . 5,550 4,125 14,988
Total adjustments . . . . . . . . . . . . . . . . . . . . . . . . (61,934) 15,858 234,255
Net cash provided by operating activities . . . . . 145,388 202,103 400,294
Cash flows from investing activities:
Principal collected on loans and leases . . . . . . . . . . . . . . . . . 3,352,341 2,162,839 2,315,173
Originations and purchases of loans . . . . . . . . . . . . . . . . . . (2,719,682) (2,320,239) (3,069,408)
Purchases of equipment for lease financing . . . . . . . . . . . . . (449,231) (579,595) (289,156)
Net (increase) decrease in interest-bearing deposits with banks . . (559) 19,987 95,575
Proceeds from sales of securities available for sale . . . . . . . . . 33,645 – 288,718
Proceeds from maturities of and principal collected on
securities available for sale . . . . . . . . . . . . . . . . . . . . . . . 398,316 176,905 577,844
Purchases of securities available for sale . . . . . . . . . . . . . . . . (587,324) (314) (791,995)
Net decrease in federal funds sold . . . . . . . . . . . . . . . . . . . . – 41,000
Net increase in Federal Home Loan Bank stock . . . . . . . . . . (18,927) (4,671) (11,129)
Sales of deposits, net of cash paid . . . . . . . . . . . . . . . . . . . . (26,958) (82,097) (104,404)
Other, net . . . . . . . . . . . . . . . . . . . . . . . . . . . . . . . . . . . . . (64,313) (48,329) 18,852
Net cash used by investing activities . . . . . . . . . . . . . . . . . (82,692) (675,514) (928,930)
Cash flows from financing activities:
Net increase (decrease) in deposits . . . . . . . . . . . . . . . . . . . 237,180 402,731 (13,649)
Net increase (decrease) in short-term borrowings . . . . . . . . . (178,836) (168,287) 674,431
Proceeds from long-term borrowings . . . . . . . . . . . . . . . . . 677,334 954,252 1,566,253
Payments on long-term borrowings . . . . . . . . . . . . . . . . . . . (579,529) (619,250) (1,529,301)
Purchases of common stock . . . . . . . . . . . . . . . . . . . . . . . . (148,043) (73,824) (106,106)
Payments of dividends on common stock . . . . . . . . . . . . . . . (77,473) (66,101) (60,755)
Other, net . . . . . . . . . . . . . . . . . . . . . . . . . . . . . . . . . . . . . 1,364 6,635 6,548
Net cash provided (used) by financing activities . . . . . . . . (68,003) 436,156 537,421
Net increase (decrease) in cash and due from banks . . . . . . . . . . (5,307) (37,255) 8,785
Cash and due from banks at beginning of year . . . . . . . . . . . . . . 392,007 429,262 420,477
Cash and due from banks at end of year . . . . . . . . . . . . . . . . . . $ 386,700 $ 392,007 $ 429,262
Supplemental disclosures of
cash flow information:
Cash paid for:
Interest on deposits and borrowings . . . . . . . . . . . . . . . . $ 352,903 $ 377,430 $ 302,268
Income taxes . . . . . . . . . . . . . . . . . . . . . . . . . . . . . . . . . $ 24,128 $ 89,852 $ 78,125
Transfer of loans and leases to other real estate owned and
other assets . . . . . . . . . . . . . . . . . . . . . . . . . . . . . . . . . . $ 33,447 $ 16,580 $ 32,074
See accompanying notes to consolidated financial statements.