TCF Bank 2001 Annual Report Download - page 66
Download and view the complete annual report
Please find page 66 of the 2001 TCF Bank annual report below. You can navigate through the pages in the report by either clicking on the pages listed below, or by using the keyword search tool below to find specific information within the annual report.-
 1
1 -
2
-
3
-
4
-
5
-
6
-
7
-
8
-
9
-
10
-
11
-
12
-
13
-
14
-
15
-
16
-
17
-
18
-
19
-
20
-
21
-
22
-
23
-
24
-
25
-
26
-
27
-
28
-
29
-
30
-
31
-
32
-
33
-
34
-
35
-
36
-
37
-
38
-
39
-
40
-
41
-
42
-
43
-
44
-
45
-
46
-
47
-
48
-
49
-
50
-
51
-
52
-
53
-
54
-
55
-
 56
56 -
 57
57 -
 58
58 -
 59
59 -
 60
60 -
 61
61 -
 62
62 -
 63
63 -
 64
64 -
 65
65 -
 66
66 -
 67
67 -
 68
68 -
 69
69 -
 70
70 -
 71
71 -
 72
72 -
 73
73 -
 74
74 -
 75
75 -
 76
76 -
77
-
78
-
79
-
80
-
81
-
82
 |
 |

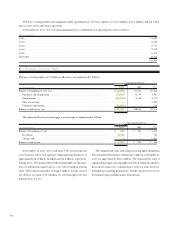
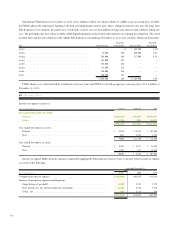
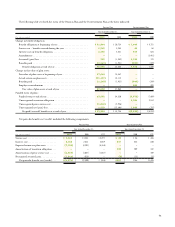
17 Employee Benefit Plans
The TCF Cash Balance Pension Plan (the “Pension Plan”) is a qual-
ified defined benefit plan covering all “regular stated salary” employ-
ees and certain part-time employees who are at least 21 years old and
have completed a year of eligibility service with TCF. TCF makes a
monthly allocation to the participant’s account based on a percentage
of the participant’s compensation. The percentage is based on the sum
of the participant’s age and years of employment with TCF. Participants
are fully vested after five years of qualifying service.
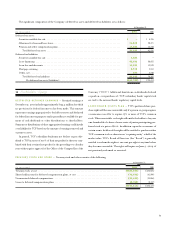
In addition to providing retirement income benefits, TCF provides
health care benefits for eligible retired employees, and in some cases
life insurance benefits (the “Postretirement Plan”). Substantially all
full-time employees may become eligible for health care benefits if they
reach retirement age and have completed ten years of service with the
Company, with certain exceptions. Effective January 1, 2000, TCF
modified the Postretirement Plan by eliminating the Company subsidy
for employees not yet eligible for benefits under the Postretirement Plan.
The plan provisions for full-time and retired employees then eligible
for these benefits were not changed. These and similar benefits for
active employees are provided through insurance companies or through
self-funded programs. The Postretirement Plan is an unfunded plan.
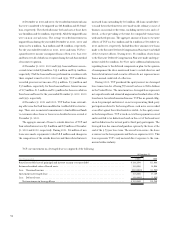
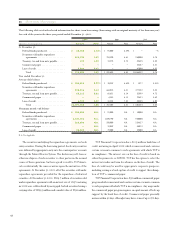
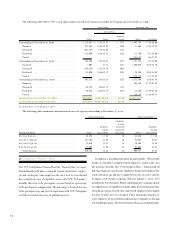
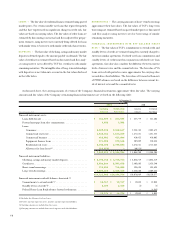
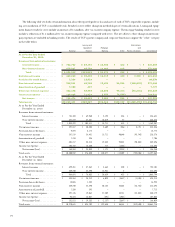
The following table reflects TCF’s stock option and restricted stock transactions under the Program since December 31, 1998:
Stock Options Restricted Stock
Exercise Price
Weighted-
Shares Range Average Shares Price Range
Outstanding at December 31, 1998 . . . . . . . . . . . . . . . . 1,178,657 $ 2.22-33.28 $ 17.67 1,443,734 $ 7.66-34.00
Granted . . . . . . . . . . . . . . . . . . . . . . . . . . . . . . . 247,550 23.56-29.03 25.25 21,050 22.53-28.59
Exercised . . . . . . . . . . . . . . . . . . . . . . . . . . . . . . . (551,107) 2.22-23.69 11.73 – –
Forfeited . . . . . . . . . . . . . . . . . . . . . . . . . . . . . . . (112,000) 23.56-33.28 32.36 (11,760) 8.11-34.00
Vested . . . . . . . . . . . . . . . . . . . . . . . . . . . . . . . . . . – – – (331,889) 7.66-27.34
Outstanding at December 31, 1999 . . . . . . . . . . . . . . . . 763,100 2.63-33.28 22.27 1,121,135 8.11-34.00
Granted . . . . . . . . . . . . . . . . . . . . . . . . . . . . . . . 1,000 21.81 21.81 1,300,080 22.10-43.70
Exercised . . . . . . . . . . . . . . . . . . . . . . . . . . . . . . . (283,585) 2.63-28.88 20.25 – –
Forfeited . . . . . . . . . . . . . . . . . . . . . . . . . . . . . . . (13,000) 23.56-32.19 28.32 (20,940) 20.88-34.00
Vested . . . . . . . . . . . . . . . . . . . . . . . . . . . . . . . . . . – – – (125,175) 8.11-28.59
Outstanding at December 31, 2000 . . . . . . . . . . . . . . . 467,515 3.46-33.28 23.32 2,275,100 16.56-43.70
Granted . . . . . . . . . . . . . . . . . . . . . . . . . . . . . . . – – – 262,340 27.98–48.20
Exercised . . . . . . . . . . . . . . . . . . . . . . . . . . . . . . . (86,832) 3.46–32.19 17.47 – –
Forfeited . . . . . . . . . . . . . . . . . . . . . . . . . . . . . . . (10,558) 23.56–32.19 24.73 (18,850) 27.98–48.20
Vested . . . . . . . . . . . . . . . . . . . . . . . . . . . . . . . . . . – – – (59,179) 16.56–40.75
Outstanding at December 31, 2001. . . . . . . . . . . . . . 370,125 5.33–33.28 24.65 2,459,411(1)
Exercisable at December 31, 2001. . . . . . . . . . . . . . . 204,127 5.33–33.28 22.48
(1) 848,899 shares vested on January 2, 2002.
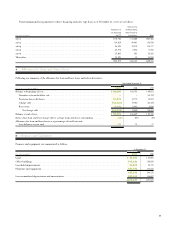
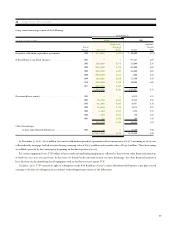
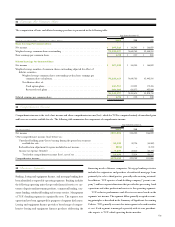
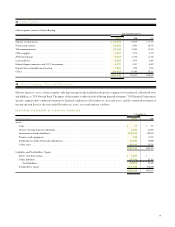
The following table summarizes information about stock options outstanding at December 31, 2001:
Options Outstanding Options Exercisable
Weighted-
Average
Weighted- Remaining Weighted-
Average Contractual Average
Exercise Price Range Shares Exercise Price Life in Years Shares Exercise Price
$5.33 to $20.00 . . . . . . . . . . . . . . . . . . . . . . . . . . . . 43,325 $ 7.83 1.9 43,325 $ 7.83
$20.01 to $25.00 . . . . . . . . . . . . . . . . . . . . . . . . . . . 167,250 23.59 7.0 96,902 23.61
$25.01 to $30.00. . . . . . . . . . . . . . . . . . . . . . . . . . . . 72,050 28.91 7.5 30,400 28.94
$30.01 to $33.28 . . . . . . . . . . . . . . . . . . . . . . . . . . . . 87,500 31.50 6.1 33,500 32.26
Total Options . . . . . . . . . . . . . . . . . . . . . . . . . . . . 370,125 24.65 6.3 204,127 22.48
64