TCF Bank 2001 Annual Report Download - page 43
Download and view the complete annual report
Please find page 43 of the 2001 TCF Bank annual report below. You can navigate through the pages in the report by either clicking on the pages listed below, or by using the keyword search tool below to find specific information within the annual report.-
 1
1 -
2
-
3
-
4
-
5
-
6
-
7
-
8
-
9
-
10
-
11
-
12
-
13
-
14
-
15
-
16
-
17
-
18
-
19
-
20
-
21
-
22
-
23
-
24
-
25
-
26
-
27
-
28
-
29
-
30
-
31
-
32
-
 33
33 -
 34
34 -
 35
35 -
 36
36 -
 37
37 -
 38
38 -
 39
39 -
 40
40 -
 41
41 -
 42
42 -
 43
43 -
 44
44 -
 45
45 -
 46
46 -
 47
47 -
 48
48 -
 49
49 -
 50
50 -
 51
51 -
 52
52 -
 53
53 -
54
-
55
-
56
-
57
-
58
-
59
-
60
-
61
-
62
-
63
-
64
-
65
-
66
-
67
-
68
-
69
-
70
-
71
-
72
-
73
-
74
-
75
-
76
-
77
-
78
-
79
-
80
-
81
-
82
 |
 |

41
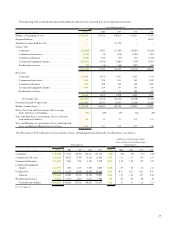
environment. In addition to the interest-rate gap analysis, manage-
ment also utilizes a simulation model to measure and manage TCF’s
interest-rate risk, relative to a base case scenario.
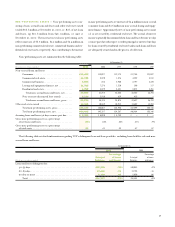
The amounts in the maturity/rate sensitivity table below repre-
sent management’s estimates and assumptions. The amounts could
be significantly affected by external factors such as prepayment rates
other than those assumed, early withdrawals of deposits, changes in
the correlation of various interest-bearing instruments, competi-
tion, a general rise or decline in interest rates, and the possibility that
the FHLB will exercise its option to call certain of TCF’s longer-term
FHLB advances. Decisions by management to purchase or sell assets,
or retire debt could change the maturity/repricing and spread rela-
tionships. In addition, TCF’s interest-rate risk will increase during
periods of rising interest rates due to slower prepayments on loans
and mortgage-backed securities. TCF’s one-year adjusted interest-
rate gap was a positive $241.8 million, or 2% of total assets, at
December 31, 2001, compared with a negative $215.1 million, or
(2)% of total assets, at December 31, 2000. A positive interest-rate
gap position exists when the amount of interest-earning assets matur-
ing or repricing within a particular time period exceeds the amount
of interest-bearing liabilities maturing or repricing. The change in
the one-year gap was primarily due to an increase in projected pre-
payment speeds on residential loans and mortgage-backed securities,
partially offset by the impact of interest-rate floors on consumer loans.
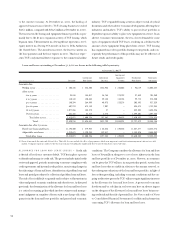
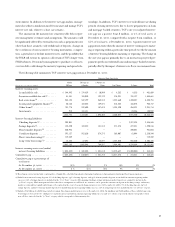
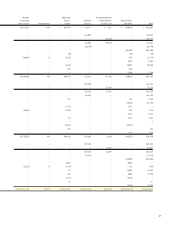
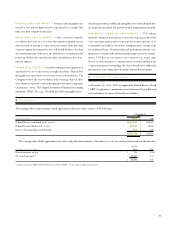
The following table summarizes TCF’s interest-rate gap position at December 31, 2001:
Maturity/Rate Sensitivity
Within 30 Days to 6 Months to
(Dollars in thousands) 30 Days 6 Months 1 Year 1 to 3 Years 3+ Years Total
Interest-earning assets:
Loans held for sale . . . . . . . . . . . . . $ 244,993 $ 178,839 $ 10,909 $ 8,353 $ 8,515 $ 451,609
Securities available for sale(1) . . . . . . 41,841 185,030 192,732 376,931 788,127 1,584,661
Real estate loans(1) . . . . . . . . . . . . . 544,123 542,199 565,312 1,223,660 1,480,457 4,355,751
Leasing and equipment finance(1) . . 40,136 164,452 169,821 416,254 166,074 956,737
Other loans(1) . . . . . . . . . . . . . . . . 751,775 232,600 157,628 1,334,890 454,821 2,931,714
Investments . . . . . . . . . . . . . . . . . . 915 131,181 – – 23,846 155,942
1,623,783 1,434,301 1,096,402 3,360,088 2,921,840 10,436,414
Interest-bearing liabilities:
Checking deposits(2) . . . . . . . . . . . . 209,041–––2,327,824 2,536,865
Savings deposits(2). . . . . . . . . . . . . . 185,820 124,823 131,318 371,374 477,481 1,290,816
Money market deposits(2) . . . . . . . . 560,983–––390,051 951,034
Certificate deposits . . . . . . . . . . . . . 392,137 923,630 578,372 365,007 61,098 2,320,244
Short-term borrowings(3) . . . . . . . . 719,859––––719,859
Long-term borrowings(3) . . . . . . . . 14,325 37,493 34,897 1,248,020 968,430 2,303,165
2,082,165 1,085,946 744,587 1,984,401 4,224,884 10,121,983
Interest-earning assets over (under)
interest-bearing liabilities . . . . . . . . $ (458,382) $ 348,355 $ 351,815 $1,375,687 $(1,303,044) $ 314,431
Cumulative gap . . . . . . . . . . . . . . . . . . $ (458,382) $ (110,027) $ 241,788 $1,617,475 $ 314,431 $ 314,431
Cumulative gap as a percentage of
total assets:
At December 31, 2001. . . . . . . . . . . (4)% (1)% 2 % 14% 3% 3%
At December 31, 2000 . . . . . . . . . . 6 % (2)% (2)% 9% 2% 2%
(1) Based upon contractual maturity, repricing date, if applicable, scheduled repayments of principal and projected prepayments of principal based upon experience.
(2)Includes non-interest bearing deposits. 8% of checking deposits, 34% of savings deposits, and 59% of money market deposits are included in amounts repricing within
one year. 29% of savings deposits are included in the “1 to 3 Years” category. All remaining checking, savings and money market deposits are assumed to mature in the
“3+ Years” category. While management believes that these assumptions are well based, no assurance can be given that amounts on deposit in checking, savings, and money
market accounts will not significantly change or be repriced in the event of a general change in interest rates. At December 31, 2000, 8% of checking deposits, 34% of
savings deposits, and 53% of money market deposits were included in amounts repricing within one year. 29% of savings deposits were included in the “1 to 3 Years” category.
(3)Includes $1.5 billion of callable long-term borrowings. Based upon market interest rates at December 31, 2001, $5.5 million and $200 million of these callable long-term
borrowings are forecasted to be called prior to maturity and are included in amounts repricing within one year and “1 to 3 Years”, respectively, which corresponds to their
next call date, instead of in the “3+ Years” category, which corresponds to their maturity date.