TCF Bank 2001 Annual Report Download - page 55
Download and view the complete annual report
Please find page 55 of the 2001 TCF Bank annual report below. You can navigate through the pages in the report by either clicking on the pages listed below, or by using the keyword search tool below to find specific information within the annual report.-
 1
1 -
2
-
3
-
4
-
5
-
6
-
7
-
8
-
9
-
10
-
11
-
12
-
13
-
14
-
15
-
16
-
17
-
18
-
19
-
20
-
21
-
22
-
23
-
24
-
25
-
26
-
27
-
28
-
29
-
30
-
31
-
32
-
33
-
34
-
35
-
36
-
37
-
38
-
39
-
40
-
41
-
42
-
43
-
44
-
 45
45 -
 46
46 -
 47
47 -
 48
48 -
 49
49 -
 50
50 -
 51
51 -
 52
52 -
 53
53 -
 54
54 -
 55
55 -
 56
56 -
 57
57 -
 58
58 -
 59
59 -
 60
60 -
 61
61 -
 62
62 -
 63
63 -
 64
64 -
 65
65 -
66
-
67
-
68
-
69
-
70
-
71
-
72
-
73
-
74
-
75
-
76
-
77
-
78
-
79
-
80
-
81
-
82
 |
 |
53
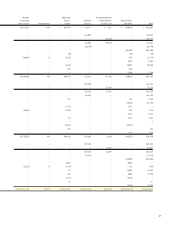
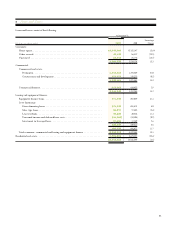
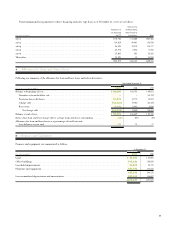
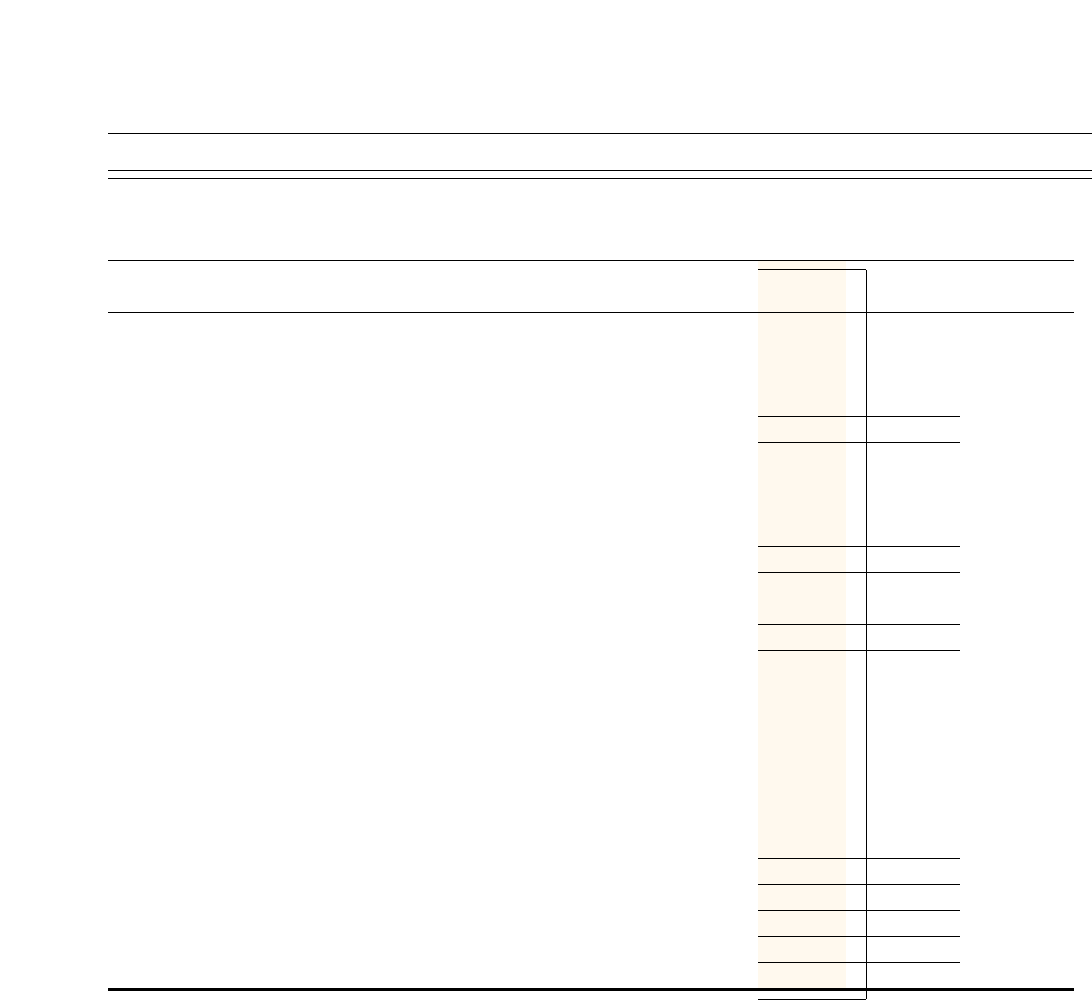
6Loans and Leases
Loans and leases consist of the following:
At December 31,
Percentage
(Dollars in thousands) 2001 2000 Change
Consumer:
Home equity. . . . . . . . . . . . . . . . . . . . . . . . . . . . . . . . . . . . . . . . . . . . . . . . . . . $2,443,788 $2,152,147 13.6%
Other secured. . . . . . . . . . . . . . . . . . . . . . . . . . . . . . . . . . . . . . . . . . . . . . . . . . 43,433 56,812 (23.5)
Unsecured . . . . . . . . . . . . . . . . . . . . . . . . . . . . . . . . . . . . . . . . . . . . . . . . . . . . 22,112 25,175 (12.2)
2,509,333 2,234,134 12.3
Commercial:
Commercial real estate:
Permanent. . . . . . . . . . . . . . . . . . . . . . . . . . . . . . . . . . . . . . . . . . . . . . . . . . 1,444,484 1,193,469 21.0
Construction and development . . . . . . . . . . . . . . . . . . . . . . . . . . . . . . . . . . . 177,977 178,372 (0.2)
1,622,461 1,371,841 18.3
Commercial business. . . . . . . . . . . . . . . . . . . . . . . . . . . . . . . . . . . . . . . . . . . . . 422,381 410,422 2.9
2,044,842 1,782,263 14.7
Leasing and equipment finance:
Equipment finance loans . . . . . . . . . . . . . . . . . . . . . . . . . . . . . . . . . . . . . . . . . . 271,398 207,059 31.1
Lease financings:
Direct financing leases . . . . . . . . . . . . . . . . . . . . . . . . . . . . . . . . . . . . . . . . . 691,899 658,678 5.0
Sales-type leases . . . . . . . . . . . . . . . . . . . . . . . . . . . . . . . . . . . . . . . . . . . . . . 36,272 37,645 (3.6)
Lease residuals . . . . . . . . . . . . . . . . . . . . . . . . . . . . . . . . . . . . . . . . . . . . . . . 33,860 30,426 11.3
Unearned income and deferred lease costs . . . . . . . . . . . . . . . . . . . . . . . . . . . (94,300) (94,506) (0.2)
Investment in leveraged lease. . . . . . . . . . . . . . . . . . . . . . . . . . . . . . . . . . . . . 17,608 17,169 2.6
685,339 649,412 5.5
956,737 856,471 11.7
Total consumer, commercial and leasing and equipment finance . . . . . . . . . . . . . 5,510,912 4,872,868 13.1
Residential real estate . . . . . . . . . . . . . . . . . . . . . . . . . . . . . . . . . . . . . . . . . . . . . . . 2,733,290 3,673,831 (25.6)
$8,244,202 $8,546,699 (3.5)