TCF Bank 2001 Annual Report Download - page 72
Download and view the complete annual report
Please find page 72 of the 2001 TCF Bank annual report below. You can navigate through the pages in the report by either clicking on the pages listed below, or by using the keyword search tool below to find specific information within the annual report.-
 1
1 -
2
-
3
-
4
-
5
-
6
-
7
-
8
-
9
-
10
-
11
-
12
-
13
-
14
-
15
-
16
-
17
-
18
-
19
-
20
-
21
-
22
-
23
-
24
-
25
-
26
-
27
-
28
-
29
-
30
-
31
-
32
-
33
-
34
-
35
-
36
-
37
-
38
-
39
-
40
-
41
-
42
-
43
-
44
-
45
-
46
-
47
-
48
-
49
-
50
-
51
-
52
-
53
-
54
-
55
-
56
-
57
-
58
-
59
-
60
-
61
-
 62
62 -
 63
63 -
 64
64 -
 65
65 -
 66
66 -
 67
67 -
 68
68 -
 69
69 -
 70
70 -
 71
71 -
 72
72 -
 73
73 -
 74
74 -
 75
75 -
 76
76 -
 77
77 -
 78
78 -
 79
79 -
 80
80 -
 81
81 -
 82
82
 |
 |

70
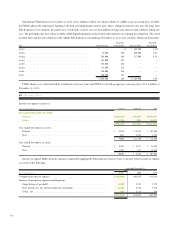
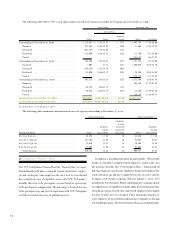
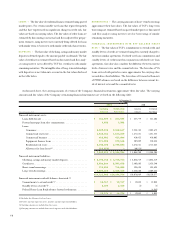
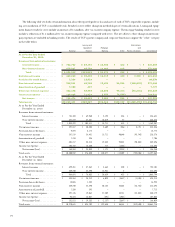
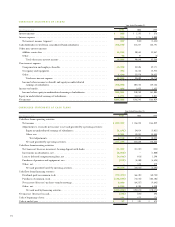
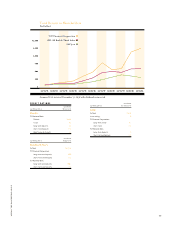
The following table sets forth certain information about the reported profit or loss and assets of each of TCF’s reportable segments, includ-
ing a reconciliation of TCF’s consolidated totals. Results for 2001 reflect changes in methodologies of certain allocations. Leasing and equip-
ment finance results for 2001 include an increase of $1.5 million, after-tax, in intercompany expense. The mortgage banking results for 2001
include a reduction of $1.2 million after-tax, in intercompany expense compared with 2000. The net offsets to these changes in intercom-
pany expenses are included in banking results. The results of TCF’s parent company and corporate functions comprise the “other” category
in the table below.
Leasing and Eliminations
Equipment Mortgage and
(In thousands) Banking Finance Banking Other Reclassifications Consolidated
At or For the Year Ended
December 31, 2001:
Revenues from external customers:
Interest income . . . . . . . . . . . . $ 722,722 $ 89,131 $ 14,334 $ 422 $ – $ 826,609
Non-interest income . . . . . . . . 313,501 45,730 12,042 213 – 371,486
Total. . . . . . . . . . . . . . . . . . $ 1,036,223 $134,861 $ 26,376 $ 635 $ – $ 1,198,095
Net interest income . . . . . . . . . . . $ 423,043 $ 39,429 $ 14,919 $ 433 $ 3,398 $ 481,222
Provision for credit losses . . . . . . . 7,359 13,519 – – – 20,878
Non-interest income. . . . . . . . . . . 313,501 45,730 15,439 96,829 (100,013) 371,486
Amortization of goodwill . . . . . . . . 7,350 427 – – – 7,777
Other non-interest expense . . . . . 432,298 38,369 20,893 99,274 (96,615) 494,219
Income tax expense . . . . . . . . . . . 109,063 12,410 3,577 (2,538) – 122,512
Net income. . . . . . . . . . . . . . . . $ 180,474 $ 20,434 $ 5,888 $ 526 $ – $ 207,322
Total assets . . . . . . . . . . . . . . . . . $10,982,411 $988,387 $374,263 $102,132 $(1,088,478) $11,358,715
At or For the Year Ended
December 31, 2000:
Revenues from external customers:
Interest income . . . . . . . . . . . . . $ 751,103 $ 69,960 $ 5,192 $ 426 $ – $ 826,681
Non-interest income . . . . . . . . . 287,219 38,451 10,519 87 – 336,276
Total . . . . . . . . . . . . . . . . . . $ 1,038,322 $ 108,411 $ 15,711 $ 513 $ – $ 1,162,957
Net interest income. . . . . . . . . . . . . $ 397,887 $ 30,405 $ 5,609 $ (556) $ 5,191 $ 438,536
Provision for credit losses . . . . . . . . 9,594 5,178–––14,772
Non-interest income . . . . . . . . . . . 287,219 38,451 15,711 90,640 (95,745) 336,276
Amortization of goodwill . . . . . . . . . 7,310 396–––7,706
Other non-interest expense. . . . . . . 401,217 25,813 19,432 93,588 (90,554) 449,496
Income tax expense . . . . . . . . . . . . . 102,722 14,420 717 (1,266) – 116,593
Net income (loss). . . . . . . . . . . . $ 164,263 $ 23,049 $ 1,171 $ (2,238) $ – $ 186,245
Total assets . . . . . . . . . . . . . . . . . . . $ 10,800,942 $ 876,540 $ 130,477 $ 112,309 $ (722,806) $ 11,197,462
At or For the Year Ended
December 31, 1999:
Revenues from external customers:
Interest income . . . . . . . . . . . . . $ 699,451 $ 47,562 $ 4,668 $ 420 $ – $ 752,101
Non-interest income . . . . . . . . . 269,240 28,490 15,961 2 – 313,693
Total . . . . . . . . . . . . . . . . . . $ 968,691 $ 76,052 $ 20,629 $ 422 $ – $ 1,065,794
Net interest income. . . . . . . . . . . . . $ 398,264 $ 25,212 $ 6,029 $ (3,487) $ (1,805) $ 424,213
Provision for credit losses . . . . . . . . 15,065 1,858–––16,923
Non-interest income . . . . . . . . . . . 269,240 28,490 20,152 82,564 (86,753) 313,693
Amortization of goodwill . . . . . . . . . 7,320 393–––7,713
Other non-interest expense. . . . . . . 397,135 19,062 27,809 84,731 (88,558) 440,179
Income tax expense . . . . . . . . . . . . . 96,473 13,037 (491) (1,967) – 107,052
Net income (loss). . . . . . . . . . . . $ 151,511 $ 19,352 $ (1,137) $ (3,687) $ – $ 166,039
Total assets . . . . . . . . . . . . . . . . . . . $ 10,270,641 $ 524,702 $ 122,685 $ 56,188 $ (312,500) $ 10,661,716