TCF Bank 2001 Annual Report Download - page 25
Download and view the complete annual report
Please find page 25 of the 2001 TCF Bank annual report below. You can navigate through the pages in the report by either clicking on the pages listed below, or by using the keyword search tool below to find specific information within the annual report.-
 1
1 -
2
-
3
-
4
-
5
-
6
-
7
-
8
-
9
-
10
-
11
-
12
-
13
-
14
-
 15
15 -
 16
16 -
 17
17 -
 18
18 -
 19
19 -
 20
20 -
 21
21 -
 22
22 -
 23
23 -
 24
24 -
 25
25 -
 26
26 -
 27
27 -
 28
28 -
 29
29 -
 30
30 -
 31
31 -
 32
32 -
 33
33 -
 34
34 -
 35
35 -
36
-
37
-
38
-
39
-
40
-
41
-
42
-
43
-
44
-
45
-
46
-
47
-
48
-
49
-
50
-
51
-
52
-
53
-
54
-
55
-
56
-
57
-
58
-
59
-
60
-
61
-
62
-
63
-
64
-
65
-
66
-
67
-
68
-
69
-
70
-
71
-
72
-
73
-
74
-
75
-
76
-
77
-
78
-
79
-
80
-
81
-
82
 |
 |

23
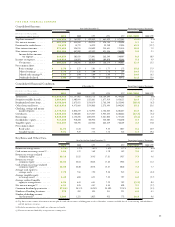
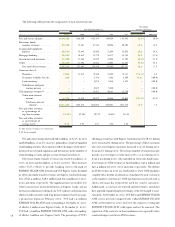
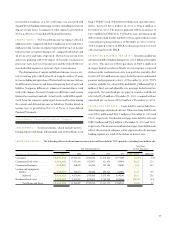
FIVE YEAR FINANCIAL SUMMARY
Consolidated Income: Year Ended December 31, Percentage Increase (Decrease)
(Dollars in thousands,
except per-share data) 2001 2000 1999 1998 1997 2001/2000 2000/1999
Top-line revenue(1) . . . . . . . $ 848,529 $ 761,999 $ 698,533 $ 661,429 $ 577,363 11.4% 9.1%
Net interest income. . . . . . . $ 481,222 $ 438,536 $ 424,213 $ 425,734 $ 393,596 9.7 3.4
Provision for credit losses . . . 20,878 14,772 16,923 23,280 17,995 41.3 (12.7)
Non-interest income. . . . . . 371,486 336,276 313,693 284,681 221,815 10.5 7.2
Non-interest expense . . . . . 501,996 457,202 447,892 421,886 356,509 9.8 2.1
Income before income
tax expense . . . . . . . . 329,834 302,838 273,091 265,249 240,907 8.9 10.9
Income tax expense . . . . . . . 122,512 116,593 107,052 109,070 95,846 5.1 8.9
Net income . . . . . . . . . . $ 207,322 $ 186,245 $ 166,039 $ 156,179 $ 145,061 11.3 12.2
Per common share:
Basic earnings . . . . . . . . $ 2.73 $ 2.37 $ 2.01 $ 1.77 $ 1.72 15.2 17.9
Diluted earnings . . . . . . $ 2.70 $ 2.35 $ 2.00 $ 1.76 $ 1.69 14.9 17.5
Diluted cash earnings(2). . $ 2.80 $ 2.44 $ 2.09 $ 1.84 $ 1.73 14.8 16.2
Dividends declared . . . . . $ 1.00 $ .825 $ .725 $ .6125 $ .46875 21.2 13.8
Consolidated Financial Condition: At December 31, Percentage Increase (Decrease)
(Dollars in thousands,
except per-share data) 2001 2000 1999 1998 1997 2001/2000 2000/1999
Total assets . . . . . . . . . . . . . $11,358,715 $11,197,462 $10,661,716 $10,164,594 $9,744,660 1.4% 5.0%
Securities available for sale . . . 1,584,661 1,403,888 1,521,661 1,677,919 1,426,131 12.9 (7.7)
Residential real estate loans . . . 2,733,290 3,673,831 3,919,678 3,765,280 3,623,845 (25.6) (6.3)
Other loans and leases . . . . . 5,510,912 4,872,868 3,976,065 3,375,898 3,445,343 13.1 22.6
Checking, savings and money
market deposits. . . . . . . . 4,778,714 4,086,219 3,712,988 3,756,558 3,301,647 16.9 10.1
Certificates . . . . . . . . . . . . . 2,320,244 2,805,605 2,871,847 2,958,588 3,605,663 (17.3) (2.3)
Borrowings . . . . . . . . . . . . . 3,023,025 3,184,245 3,083,888 2,461,046 1,727,152 (5.1) 3.3
Stockholders’ equity. . . . . . . 917,033 910,220 808,982 845,502 953,680 0.7 12.5
Tangible equity . . . . . . . . . . 762,327 745,798 637,252 662,619 756,159 2.2 17.0
Per common share:
Book value . . . . . . . . . . . 11.92 11.34 9.87 9.88 10.27 5.1 14.9
Tangible equity . . . . . . . . 9.91 9.29 7.78 7.74 8.15 6.7 19.4
Key Ratios and Other Data: At or For the Year Ended December 31, Percentage Increase (Decrease)
2001 2000 1999 1998 1997 2001/2000 2000/1999
Return on average assets . . . . . . . . 1.79% 1.72% 1.61% 1.62% 1.77% 4.1% 6.8%
Cash return on average assets(2). . . 1.86 1.79 1.69 1.70 1.82 3.9 5.9
Return on average realized
common equity . . . . . . . . . . . 23.18 21.53 19.83 17.51 19.57 7.7 8.6
Return on average
common equity . . . . . . . . . . . 23.06 22.64 20.34 17.34 19.45 1.9 11.3
Cash return on average realized
common equity(2) . . . . . . . . . . 24.03 22.40 20.74 18.37 20.10 7.3 7.7
Average total equity to
average assets . . . . . . . . . . . . . 7.78 7.58 7.93 9.35 9.12 2.6 (4.4)
Average tangible equity
to average assets . . . . . . . . . . . 6.40 6.04 6.21 7.38 7.97 6.0 (2.7)
Average realized tangible
equity to average assets . . . . . . . 6.36 6.43 6.41 7.29 7.92 (1.1) 0.3
Net interest margin(3). . . . . . . . . . 4.51 4.35 4.47 4.84 5.20 3.7 (2.7)
Common dividend payout ratio . . 37.04% 35.11% 36.25% 34.80% 27.74% 5.5 (3.1)
Number of banking locations . . . . 375 352 338 311 221 6.5 4.1
Number of checking accounts
(in thousands) . . . . . . . . . . . . 1,249 1,131 1,032 913 772 10.4 9.6
(1) Top-line revenue consists of net interest income plus fees and other revenues excluding gains on sales of branches, securities available for sale, loan servicing and subsidiaries
and title insurance revenues.
(2) Excludes amortization of goodwill, net of income tax benefit.
(3) Net interest income divided by average interest-earning assets.