TCF Bank 2001 Annual Report Download - page 46
Download and view the complete annual report
Please find page 46 of the 2001 TCF Bank annual report below. You can navigate through the pages in the report by either clicking on the pages listed below, or by using the keyword search tool below to find specific information within the annual report.-
 1
1 -
2
-
3
-
4
-
5
-
6
-
7
-
8
-
9
-
10
-
11
-
12
-
13
-
14
-
15
-
16
-
17
-
18
-
19
-
20
-
21
-
22
-
23
-
24
-
25
-
26
-
27
-
28
-
29
-
30
-
31
-
32
-
33
-
34
-
35
-
 36
36 -
 37
37 -
 38
38 -
 39
39 -
 40
40 -
 41
41 -
 42
42 -
 43
43 -
 44
44 -
 45
45 -
 46
46 -
 47
47 -
 48
48 -
 49
49 -
 50
50 -
 51
51 -
 52
52 -
 53
53 -
 54
54 -
 55
55 -
 56
56 -
57
-
58
-
59
-
60
-
61
-
62
-
63
-
64
-
65
-
66
-
67
-
68
-
69
-
70
-
71
-
72
-
73
-
74
-
75
-
76
-
77
-
78
-
79
-
80
-
81
-
82
 |
 |

44
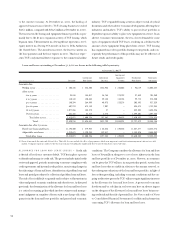
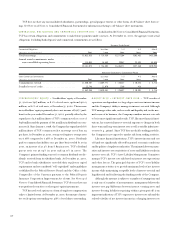
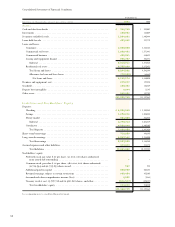
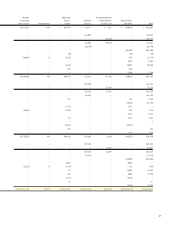
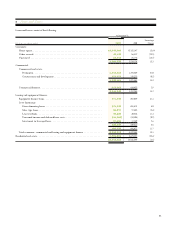
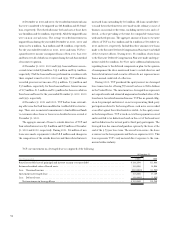
Consolidated Statements of Financial Condition
At December 31,
(Dollars in thousands, except per-share data) 2001 2000
Assets
Cash and due from banks . . . . . . . . . . . . . . . . . . . . . . . . . . . . . . . . . . . . . . . . . . . $ 386,700 $ 392,007
Investments . . . . . . . . . . . . . . . . . . . . . . . . . . . . . . . . . . . . . . . . . .. . . . . . . . . . . . . . . . . 155,942 134,059
Securities available for sale . . . . . . . . . . . . . . . . . . . . . . . . . . . . . . . . . . . . . . . . . . . 1,584,661 1,403,888
Loans held for sale . . . . . . . . . . . . . . . . . . . . . . . . . . . . . . . . . . . . . . . . . . . . . . . . 451,609 227,779
Loans and leases:
Consumer . . . . . . . . . . . . . . . . . . . . . . . . . . . . . . . . . . . . . . . . . . . . . . . . . . . . 2,509,333 2,234,134
Commercial real estate . . . . . . . . . . . . . . . . . . . . . . . . . . . . . . . . . . . . . . . . . . . 1,622,461 1,371,841
Commercial business . . . . . . . . . . . . . . . . . . . . . . . . . . . . . . . . . . . . . . . . . . . . 422,381 410,422
Leasing and equipment finance . . . . . . . . . . . . . . . . . . . . . . . . . . . . . . . . . . . . . 956,737 856,471
Subtotal . . . . . . . . . . . . . . . . . . . . . . . . . . . . . . . . . . . . . . . . . . . . . . . . . . . 5,510,912 4,872,868
Residential real estate . . . . . . . . . . . . . . . . . . . . . . . . . . . . . . . . . . . . . . . . . . . . 2,733,290 3,673,831
Total loans and leases . . . . . . . . . . . . . . . . . . . . . . . . . . . . . . . . . . . . . . . . . 8,244,202 8,546,699
Allowance for loan and lease losses . . . . . . . . . . . . . . . . . . . . . . . . . . . . . . . . (75,028) (66,669)
Net loans and leases . . . . . . . . . . . . . . . . . . . . . . . . . . . . . . . . . . . . . . . . 8,169,174 8,480,030
Premises and equipment, net . . . . . . . . . . . . . . . . . . . . . . . . . . . . . . . . . . . . . . . . . 215,237 197,525
Goodwill . . . . . . . . . . . . . . . . . . . . . . . . . . . . . . . . . . . . . . . . . . . . . . . . . . . . . . . . . . . 145,462 153,239
Deposit base intangibles . . . . . . . . . . . . . . . . . . . . . . . . . . . . . . . . . . . . . . . . . . . . 9,244 11,183
Other assets . . . . . . . . . . . . . . . . . . . . . . . . . . . . . . . . . . . . . . . . . .. . . . . . . . . . . . . . . . . 240,686 197,752
$11,358,715 $11,197,462
Liabilities and Stockholders’ Equity
Deposits:
Checking . . . . . . . . . . . . . . . . . . . . . . . . . . . . . . . . . . . . . . . . .. . . . . . . . . . . . . . . . . $ 2,536,865 $ 2,203,943
Savings . . . . . . . . . . . . . . . . . . . . . . . . . . . . . . . . . . . . . . . . . . .. . . . . . . . . . . . . . . . . 1,290,816 1,045,388
Money market . . . . . . . . . . . . . . . . . . . . . . . . . . . . . . . . . . . . . . . . . . . . . . . . . 951,033 836,888
Subtotal . . . . . . . . . . . . . . . . . . . . . . . . . . . . . . . . . . . . . . . . . . . . . . . . . . . 4,778,714 4,086,219
Certificates . . . . . . . . . . . . . . . . . . . . . . . . . . . . . . . . . . . . . . . . . . . . . . . . . . . 2,320,244 2,805,605
Total deposits . . . . . . . . . . . . . . . . . . . . . . . . . . . . . . . . . . . . . . . . . . . . . . . 7,098,958 6,891,824
Short-term borrowings . . . . . . . . . . . . . . . . . . . . . . . . . . . . . . . . . . . . . . . . . . . . . 719,859 898,695
Long-term borrowings . . . . . . . . . . . . . . . . . . . . . . . . . . . . . . . . . . . . . . . . . . . . . 2,303,166 2,285,550
Total borrowings . . . . . . . . . . . . . . . . . . . . . . . . . . . . . . . . . . . . . . . . . . . . . 3,023,025 3,184,245
Accrued expenses and other liabilities . . . . . . . . . . . . . . . . . . . . . . . . . . . . . . . . . . . 319,699 211,173
Total liabilities . . . . . . . . . . . . . . . . . . . . . . . . . . . . . . . . . . . . . . . . . . . . . . 10,441,682 10,287,242
Stockholders’ equity:
Preferred stock, par value $.01 per share, 30,000,000 shares authorized;
none issued and outstanding . . . . . . . . . . . . . . . . . . . . . . . . . . . . . . . . . . . . ––
Common stock, par value $.01 per share, 280,000,000 shares authorized;
92,719,544 and 92,755,659 shares issued . . . . . . . . . . . . . . . . . . . . . . . . . . . 927 928
Additional paid-in capital . . . . . . . . . . . . . . . . . . . . . . . . . . . . . . . . . . . . . . . . 520,940 508,682
Retained earnings, subject to certain restrictions . . . . . . . . . . . . . . . . . . . . . . . . 965,454 835,605
Accumulated other comprehensive income (loss) . . . . . . . . . . . . . . . . . . . . . . . . 6,229 (9,868)
Treasury stock at cost, 15,787,716 and 12,466,626 shares, and other . . . . . . . . . . . (576,517) (425,127)
Total stockholders’ equity . . . . . . . . . . . . . . . . . . . . . . . . . . . . . . . . . . . . . . 917,033 910,220
$11,358,715 $11,197,462
See accompanying notes to consolidated financial statements.