TCF Bank 2001 Annual Report Download - page 73
Download and view the complete annual report
Please find page 73 of the 2001 TCF Bank annual report below. You can navigate through the pages in the report by either clicking on the pages listed below, or by using the keyword search tool below to find specific information within the annual report.-
 1
1 -
2
-
3
-
4
-
5
-
6
-
7
-
8
-
9
-
10
-
11
-
12
-
13
-
14
-
15
-
16
-
17
-
18
-
19
-
20
-
21
-
22
-
23
-
24
-
25
-
26
-
27
-
28
-
29
-
30
-
31
-
32
-
33
-
34
-
35
-
36
-
37
-
38
-
39
-
40
-
41
-
42
-
43
-
44
-
45
-
46
-
47
-
48
-
49
-
50
-
51
-
52
-
53
-
54
-
55
-
56
-
57
-
58
-
59
-
60
-
61
-
62
-
 63
63 -
 64
64 -
 65
65 -
 66
66 -
 67
67 -
 68
68 -
 69
69 -
 70
70 -
 71
71 -
 72
72 -
 73
73 -
 74
74 -
 75
75 -
 76
76 -
 77
77 -
 78
78 -
 79
79 -
 80
80 -
 81
81 -
 82
82
 |
 |

71
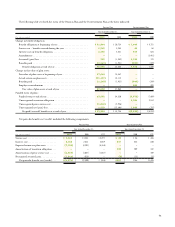
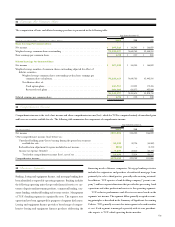
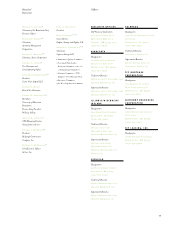
24 Other Expense
Other expense consists of the following:
Year Ended December 31,
(In thousands) 2001 2000 1999
Deposit account losses . . . . . . . . . . . . . . . . . . . . . . . . . . . . . . . . . . . . . . . . . . . . . . . . $ 19,415 $ 19,479 $ 17,172
Postage and courier . . . . . . . . . . . . . . . . . . . . . . . . . . . . . . . . . . . . . . . . . . . . . . . . . . 13,150 11,442 10,876
Telecommunication. . . . . . . . . . . . . . . . . . . . . . . . . . . . . . . . . . . . . . . . . . . . . . . . . . 11,541 13,345 13,386
Office supplies . . . . . . . . . . . . . . . . . . . . . . . . . . . . . . . . . . . . . . . . . . . . . . . . . . . . . 9,881 9,216 8,879
ATM interchange . . . . . . . . . . . . . . . . . . . . . . . . . . . . . . . . . . . . . . . . . . . . . . . . . . . 9,723 11,735 11,156
Loan and lease . . . . . . . . . . . . . . . . . . . . . . . . . . . . . . . . . . . . . . . . . . . . . . . . . . . . . 6,787 3,979 5,469
Federal deposit insurance and OCC assessments . . . . . . . . . . . . . . . . . . . . . . . . . . . . . 2,757 2,837 5,307
Deposit base intangible amortization. . . . . . . . . . . . . . . . . . . . . . . . . . . . . . . . . . . . . . 1,939 2,295 2,976
Other . . . . . . . . . . . . . . . . . . . . . . . . . . . . . . . . . . . . . . . . . . . . . . . . . . . . . . . . . . . 51,627 41,505 35,311
$126,820 $115,833 $110,532
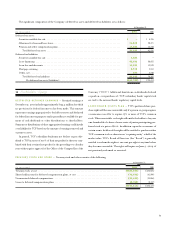
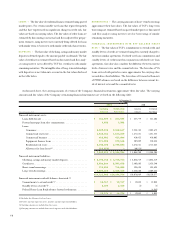
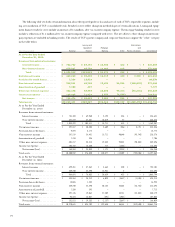
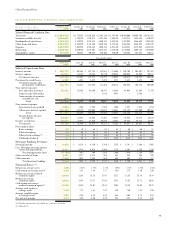
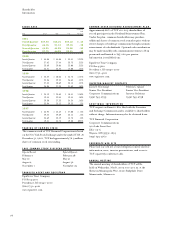
25 Parent Company Financial Information
Effective January 1, 2001, certain company-wide functions previously included in the parent company were transferred, with related assets
and liabilities, to TCF National Bank. The impact of this transfer is reflected in the following financial statements. TCF Financial Corporation’s
(parent company only) condensed statements of financial condition as of December 31, 2001 and 2000, and the condensed statements of
income and cash flows for the years ended December 31, 2001, 2000 and 1999 are as follows:
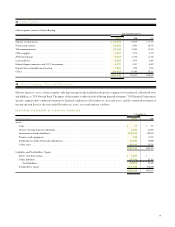
CONDENSED STATEMENTS OF FINANCIAL CONDITION
At December 31,
(In thousands) 2001 2000
Assets:
Cash . . . . . . . . . . . . . . . . . . . . . . . . . . . . . . . . . . . . . . . . . . . . . . . . . . . . . . . . . . . . . . . . . . . . . . $ 37 $ 191
Interest-bearing deposits with banks. . . . . . . . . . . . . . . . . . . . . . . . . . . . . . . . . . . . . . . . . . . . . . . . 2,657 23,996
Investment in bank subsidiaries . . . . . . . . . . . . . . . . . . . . . . . . . . . . . . . . . . . . . . . . . . . . . . . . . . . 880,200 835,933
Premises and equipment . . . . . . . . . . . . . . . . . . . . . . . . . . . . . . . . . . . . . . . . . . . . . . . . . . . . . . . . 388 11,947
Dividends receivable from bank subsidiaries . . . . . . . . . . . . . . . . . . . . . . . . . . . . . . . . . . . . . . . . . . 16,100 25,000
Other assets . . . . . . . . . . . . . . . . . . . . . . . . . . . . . . . . . . . . . . . . . . . . . . . . . . . . . . . . . . . . . . . . . 32,221 35,315
$931,603 $932,382
Liabilities and Stockholders’ Equity:
Short-term borrowings . . . . . . . . . . . . . . . . . . . . . . . . . . . . . . . . . . . . . . . . . . . . . . . . . . . . . . . . . $ 2,000 $ –
Other liabilities . . . . . . . . . . . . . . . . . . . . . . . . . . . . . . . . . . . . . . . . . . . . . . . . . . . . . . . . . . . . . . 12,570 22,162
Total liabilities . . . . . . . . . . . . . . . . . . . . . . . . . . . . . . . . . . . . . . . . . . . . . . . . . . . . . . . . . . . . 14,570 22,162
Stockholders’ equity . . . . . . . . . . . . . . . . . . . . . . . . . . . . . . . . . . . . . . . . . . . . . . . . . . . . . . . . . . . 917,033 910,220
$931,603 $932,382