TCF Bank 2001 Annual Report Download - page 3
Download and view the complete annual report
Please find page 3 of the 2001 TCF Bank annual report below. You can navigate through the pages in the report by either clicking on the pages listed below, or by using the keyword search tool below to find specific information within the annual report.-
 1
1 -
 2
2 -
 3
3 -
 4
4 -
 5
5 -
 6
6 -
 7
7 -
 8
8 -
 9
9 -
 10
10 -
 11
11 -
 12
12 -
 13
13 -
 14
14 -
15
-
16
-
17
-
18
-
19
-
20
-
21
-
22
-
23
-
24
-
25
-
26
-
27
-
28
-
29
-
30
-
31
-
32
-
33
-
34
-
35
-
36
-
37
-
38
-
39
-
40
-
41
-
42
-
43
-
44
-
45
-
46
-
47
-
48
-
49
-
50
-
51
-
52
-
53
-
54
-
55
-
56
-
57
-
58
-
59
-
60
-
61
-
62
-
63
-
64
-
65
-
66
-
67
-
68
-
69
-
70
-
71
-
72
-
73
-
74
-
75
-
76
-
77
-
78
-
79
-
80
-
81
-
82
 |
 |
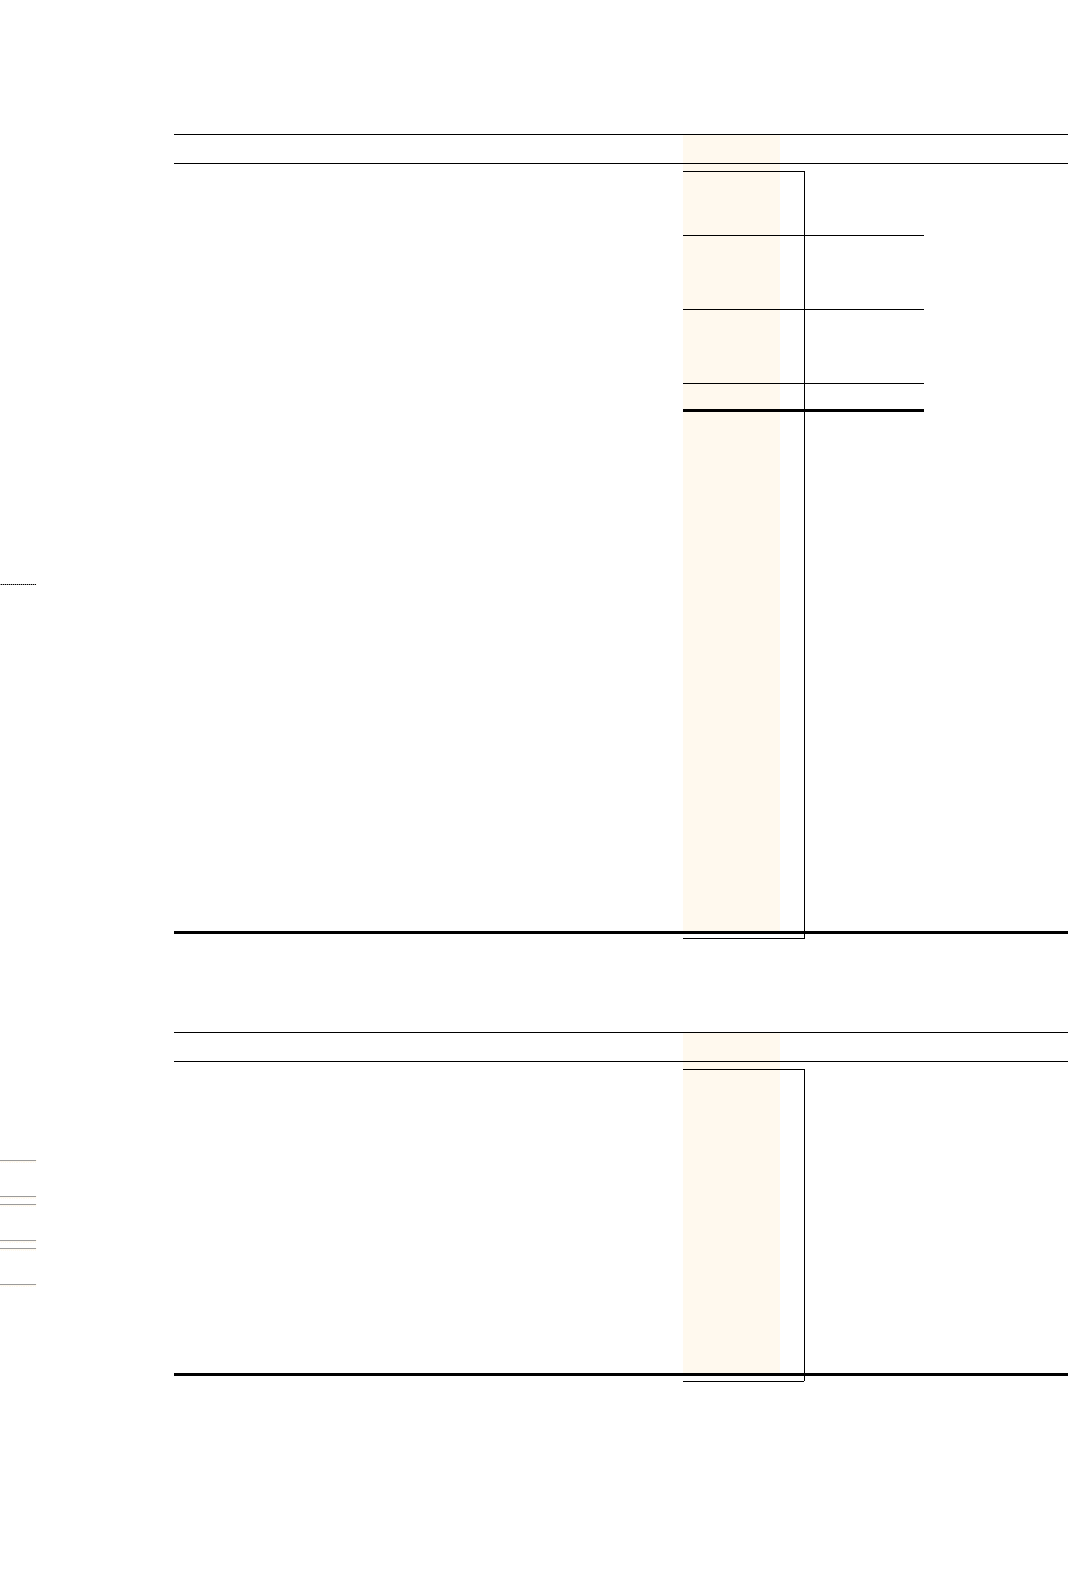
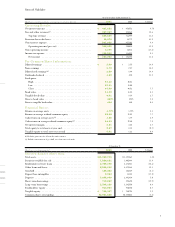
At or For the Year Ended December 31,
(Dollars in thousands, except per-share data) 2001 2000 % Change
Operating Results:
Net interest income . . . . . . . . . . . . . . . . . . . . . . . . . . . . . . . . . $ 481,222 $ 438,536 9.7%
Fees and other revenues(1) . . . . . . . . . . . . . . . . . . . . . . . . . . . . . 367,307 323,463 13.6
Top-line revenue . . . . . . . . . . . . . . . . . . . . . . . . . . . . . . . . 848,529 761,999 11.4
Provision for credit losses . . . . . . . . . . . . . . . . . . . . . . . . . . . . . 20,878 14,772 41.3
Non-interest expense . . . . . . . . . . . . . . . . . . . . . . . . . . . . . . . . 501,996 457,202 9.8
Operating income (pre-tax) . . . . . . . . . . . . . . . . . . . . . . . . 325,655 290,025 12.3
Non-operating income . . . . . . . . . . . . . . . . . . . . . . . . . . . . . . 4,179 12,813 (67.4)
Income tax expense . . . . . . . . . . . . . . . . . . . . . . . . . . . . . . . . . 122,512 116,593 5.1
Net income . . . . . . . . . . . . . . . . . . . . . . . . . . . . . . . . . . . . $ 207,322 $ 186,245 11.3
Per Common Share Information:
Diluted earnings . . . . . . . . . . . . . . . . . . . . . . . . . . . . . . . . . . . $ 2.70 $ 2.35 14.9
Basic earnings . . . . . . . . . . . . . . . . . . . . . . . . . . . . . . . . . . . . . 2.73 2.37 15.2
Diluted cash earnings(2) . . . . . . . . . . . . . . . . . . . . . . . . . . . . . . 2.80 2.44 14.8
Dividends declared . . . . . . . . . . . . . . . . . . . . . . . . . . . . . . . . . . 1.00 .825 21.2
Stock price:
High . . . . . . . . . . . . . . . . . . . . . . . . . . . . . . . . . . . . . . . . . 51.12 45.56
Low . . . . . . . . . . . . . . . . . . . . . . . . . . . . . . . . . . . . . . . . . . 32.81 18.00
Close . . . . . . . . . . . . . . . . . . . . . . . . . . . . . . . . . . . . . . . . . 47.98 44.56 7.7
Book value . . . . . . . . . . . . . . . . . . . . . . . . . . . . . . . . . . . . . . . . 11.92 11.34 5.1
Tangible book value . . . . . . . . . . . . . . . . . . . . . . . . . . . . . . . . . 9.91 9.29 6.7
Price to book value . . . . . . . . . . . . . . . . . . . . . . . . . . . . . . . . . . 403% 393% 2.5
Price to tangible book value . . . . . . . . . . . . . . . . . . . . . . . . . . . . 484 480 0.8
Financial Ratios:
Return on average assets . . . . . . . . . . . . . . . . . . . . . . . . . . . . . . 1.79% 1.72% 4.1
Return on average realized common equity . . . . . . . . . . . . . . . . 23.18 21.53 7.7
Cash return on average assets(2) . . . . . . . . . . . . . . . . . . . . . . . . . 1.86 1.79 3.9
Cash return on average realized common equity(2) . . . . . . . . . . . 24.03 22.40 7.3
Net interest margin . . . . . . . . . . . . . . . . . . . . . . . . . . . . . . . . . 4.51 4.35 3.7
Total equity to total assets at year end . . . . . . . . . . . . . . . . . . . . . 8.07 8.13 (0.7)
Tangible equity to total assets at year end . . . . . . . . . . . . . . . . . . 6.71 6.66 0.8
(1) Excludes gains on sales of branches and securities.
(2) Excludes amortization of goodwill, net of income tax benefit.
At December 31,
(Dollars in thousands) 2001 2000 % Change
Selected Balance Sheet Data:
Total assets . . . . . . . . . . . . . . . . . . . . . . . . . . . . . . . . . . . . . . . . $11,358,715 $11,197,462 1.4%
Securities available for sale . . . . . . . . . . . . . . . . . . . . . . . . . . . . 1,584,661 1,403,888 12.9
Residential real estate loans . . . . . . . . . . . . . . . . . . . . . . . . . . . . 2,733,290 3,673,831 (25.6)
Other loans and leases . . . . . . . . . . . . . . . . . . . . . . . . . . . . . . . 5,510,912 4,872,868 13.1
Goodwill . . . . . . . . . . . . . . . . . . . . . . . . . . . . . . . . . . . . . . . . . 145,462 153,239 (5.1)
Deposit base intangibles . . . . . . . . . . . . . . . . . . . . . . . . . . . . . . 9,244 11,183 (17.3)
Deposits . . . . . . . . . . . . . . . . . . . . . . . . . . . . . . . . . . . . . . . . . 7,098,958 6,891,824 3.0
Short-term borrowings . . . . . . . . . . . . . . . . . . . . . . . . . . . . . . . 719,859 898,695 (19.9)
Long-term borrowings . . . . . . . . . . . . . . . . . . . . . . . . . . . . . . . 2,303,166 2,285,550 0.8
Stockholders’ equity . . . . . . . . . . . . . . . . . . . . . . . . . . . . . . . . . 917,033 910,220 0.7
Tangible equity . . . . . . . . . . . . . . . . . . . . . . . . . . . . . . . . . . . . $ 762,327 $ 745,798 2.2
Common shares outstanding . . . . . . . . . . . . . . . . . . . . . . . . . . . 76,931,828 80,289,033 (4.2)
Financial Highlights
1