TCF Bank 2001 Annual Report Download - page 33
Download and view the complete annual report
Please find page 33 of the 2001 TCF Bank annual report below. You can navigate through the pages in the report by either clicking on the pages listed below, or by using the keyword search tool below to find specific information within the annual report.-
 1
1 -
2
-
3
-
4
-
5
-
6
-
7
-
8
-
9
-
10
-
11
-
12
-
13
-
14
-
15
-
16
-
17
-
18
-
19
-
20
-
21
-
22
-
 23
23 -
 24
24 -
 25
25 -
 26
26 -
 27
27 -
 28
28 -
 29
29 -
 30
30 -
 31
31 -
 32
32 -
 33
33 -
 34
34 -
 35
35 -
 36
36 -
 37
37 -
 38
38 -
 39
39 -
 40
40 -
 41
41 -
 42
42 -
 43
43 -
44
-
45
-
46
-
47
-
48
-
49
-
50
-
51
-
52
-
53
-
54
-
55
-
56
-
57
-
58
-
59
-
60
-
61
-
62
-
63
-
64
-
65
-
66
-
67
-
68
-
69
-
70
-
71
-
72
-
73
-
74
-
75
-
76
-
77
-
78
-
79
-
80
-
81
-
82
 |
 |

31
increased $5.3 million, or 4.8%, reflecting costs associated with
expanded retail banking and leasing activities, including increases in
deposit account losses. A summary of other expense is presented in
Note 24 of Notes to Consolidated Financial Statements.
INCOME TAXES – TCF recorded income tax expense of $122.5
million in 2001, compared with $116.6 million in 2000 and $107.1
million in 1999. Income tax expense represented 37.14% of income
before income tax expense during 2001, compared with 38.5% and
39.2% in 2000 and 1999, respectively. The lower tax rates in 2001
and 2000 primarily reflect the impact of favorable conclusion of
prior years taxes, lower state income taxes and the reduced effect of
non-deductible expenses as a percent of pre-tax net income.
The determination of current and deferred income taxes is a crit-
ical accounting policy which is based on complex analyses of many
factors including interpretation of Federal and state income tax laws,
the differences between tax and financial reporting basis of assets and
liabilities (temporary differences), estimates of amounts due or owed
such as the timing of reversal of temporary differences and current
financial accounting standards. Actual results could differ signifi-
cantly from the estimates and interpretations used in determining
the current and deferred income tax liabilities. Further detail on
income taxes is provided in Note 13 of Notes to Consolidated
Financial Statements.
Consolidated Financial Condition Analysis
INVESTMENTS – Total investments, which include interest-
bearing deposits with banks, federal funds sold, Federal Home Loan
Bank (“FHLB”) stock, Federal Reserve Bank stock and other invest-
ments, increased $21.9 million in 2001 to $155.9 million at
December 31, 2001. The increase primarily reflects an increase of
$20.7 million in FHLB stock. TCF had no non-investment grade
debt securities (junk bonds) and there were no open trading account
or investment option positions as of December 31, 2001 or 2000.
TCF is required to invest in FHLB stock in proportion to its level
of borrowings from the FHLB.
SECURITIES AVAILABLE FOR SALE – Securities available for
sale increased $180.8 million during 2001 to $1.6 billion at December
31, 2001. This increase reflects purchases of $567.3 million of
mortgage-backed securities in March 2001 in response to expected
declines in the residential real estate loan portfolio, partially offset
by sales of $33.6 million in mortgage-backed securities and normal
payment and prepayment activity. At December 31, 2001, TCF’s
securities available-for-sale portfolio included $1.5 billion and $47.2
million of fixed-rate and adjustable-rate mortgage-backed securities,
respectively. Net unrealized pre-tax gains on securities available for
sale totaled $9.8 million at December 31, 2001, compared with net
unrealized pre-tax losses of $15.6 million at December 31, 2000.
LOANS HELD FOR SALE – Loans held for sale included resi-
dential mortgage and education loans. Education loans held for sale
were $165.1 million and $153.2 million at December 31, 2001 and
2000, respectively. Residential mortgage loans held for sale were
$286.6 million and $74.5 million at December 31, 2001 and 2000,
respectively. The increase in residential mortgage loans held for sale
reflects the increase in refinance activity experienced in the mortgage
banking segment as a result of the decline in interest rates.
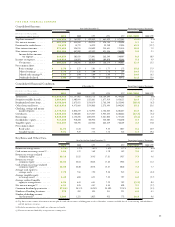
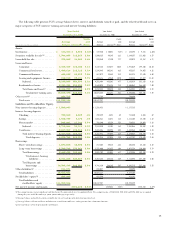
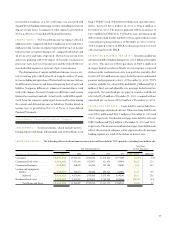
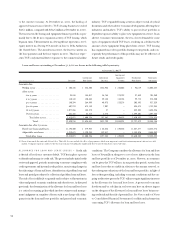
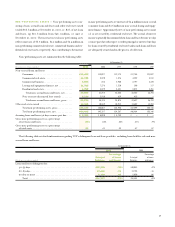
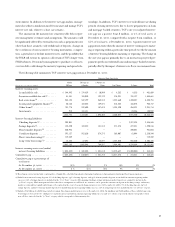
LOANS AND LEASES – The following table sets forth information about loans and leases held in TCF’s portfolio, excluding loans held for sale:
Percentage
Year Ended December 31, Increase (Decrease)
(Dollars in thousands) 2001 2000 1999 1998 1997 2001/2000 2000/1999
Consumer . . . . . . . . . . . . . . . $2,509,333 $2,234,134 $2,058,584 $1,876,554 $1,976,699 12.3% 8.5%
Commercial real estate . . . . . . 1,622,461 1,371,841 1,073,472 811,428 859,916 18.3 27.8
Commercial business . . . . . . . 422,381 410,422 351,353 289,104 240,207 2.9 16.8
Leasing and equipment
finance. . . . . . . . . . . . . . . 956,737 856,471 492,656 398,812 368,521 11.7 73.8
Subtotal. . . . . . . . . . . . 5,510,912 4,872,868 3,976,065 3,375,898 3,445,343 13.1 22.6
Residential real estate . . . . . . . 2,733,290 3,673,831 3,919,678 3,765,280 3,623,845 (25.6) (6.3)
Total loans and leases. . . $8,244,202 $8,546,699 $7,895,743 $7,141,178 $7,069,188 (3.5) 8.2