TCF Bank 2000 Annual Report Download - page 72
Download and view the complete annual report
Please find page 72 of the 2000 TCF Bank annual report below. You can navigate through the pages in the report by either clicking on the pages listed below, or by using the keyword search tool below to find specific information within the annual report.
70
TCF
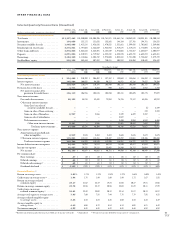
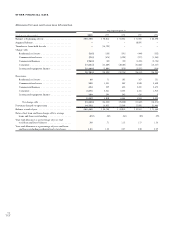
Allowance for Loan and Lease Loss Information
Year Ended December 31,
(Dollars in thousands) 2000 1999 1998 1997 1996
Balance at beginning of year . . . . . . . . . . . . . . . . . . . . $55,755 $ 80,013 $ 82,583 $ 71,865 $ 66,290
Acquired balance . . . . . . . . . . . . . . . . . . . . . . . . . . . . –– – 10,592 –
Transfers to loans held for sale . . . . . . . . . . . . . . . . . . –(14,793) – – –
Charge-offs:
Residential real estate . . . . . . . . . . . . . . . . . . . . . . (15) (155) (291) (444) (333)
Commercial real estate . . . . . . . . . . . . . . . . . . . . . (76) (674) (1,294) (927) (1,944)
Commercial business . . . . . . . . . . . . . . . . . . . . . . (360) (52) (42) (1,485) (2,786)
Consumer . . . . . . . . . . . . . . . . . . . . . . . . . . . . . . (7,041) (31,509) (30,108) (21,660) (18,317)
Leasing and equipment finance . . . . . . . . . . . . . . . (2,209) (2,008) (979) (2,297) (914)
(9,701) (34,398) (32,714) (26,813) (24,294)
Recoveries:
Residential real estate . . . . . . . . . . . . . . . . . . . . . . 28 71 103 167 131
Commercial real estate . . . . . . . . . . . . . . . . . . . . . 295 1,381 559 2,530 3,690
Commercial business . . . . . . . . . . . . . . . . . . . . . . 694 329 635 2,488 2,675
Consumer . . . . . . . . . . . . . . . . . . . . . . . . . . . . . . 4,576 5,831 5,222 3,141 1,918
Leasing and equipment finance . . . . . . . . . . . . . . . 250 398 345 618 9
5,843 8,010 6,864 8,944 8,423
Net charge-offs . . . . . . . . . . . . . . . . . . . . . . . . (3,858) (26,388) (25,850) (17,869) (15,871)
Provision charged to operations . . . . . . . . . . . . . . . . . 14,772 16,923 23,280 17,995 21,446
Balance at end of year . . . . . . . . . . . . . . . . . . . . . . . . $66,669 $ 55,755 $ 80,013 $ 82,583 $ 71,865
Ratio of net loan and lease charge-offs to average
loans and leases outstanding . . . . . . . . . . . . . . . . . .05% .35% .36% .30% .29%
Year-end allowance as a percentage of year-end
total loan and lease balances . . . . . . . . . . . . . . . . . .78 .71 1.12 1.17 1.36
Year-end allowance as a percentage of year-end loans
and leases excluding residential real estate loans . . . . 1.31 1.33 2.27 2.30 2.29
OTHER FINANCIAL DATA


