TCF Bank 2000 Annual Report Download - page 49
Download and view the complete annual report
Please find page 49 of the 2000 TCF Bank annual report below. You can navigate through the pages in the report by either clicking on the pages listed below, or by using the keyword search tool below to find specific information within the annual report.-
 1
1 -
2
-
3
-
4
-
5
-
6
-
7
-
8
-
9
-
10
-
11
-
12
-
13
-
14
-
15
-
16
-
17
-
18
-
19
-
20
-
21
-
22
-
23
-
24
-
25
-
26
-
27
-
28
-
29
-
30
-
31
-
32
-
33
-
34
-
35
-
36
-
37
-
38
-
 39
39 -
 40
40 -
 41
41 -
 42
42 -
 43
43 -
 44
44 -
 45
45 -
 46
46 -
 47
47 -
 48
48 -
 49
49 -
 50
50 -
 51
51 -
 52
52 -
 53
53 -
 54
54 -
 55
55 -
 56
56 -
 57
57 -
 58
58 -
 59
59 -
60
-
61
-
62
-
63
-
64
-
65
-
66
-
67
-
68
-
69
-
70
-
71
-
72
-
73
-
74
-
75
-
76
-
77
 |
 |

47
TCF
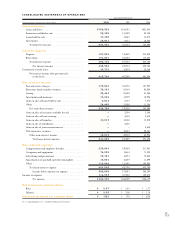
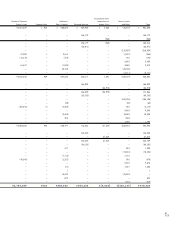
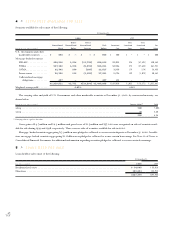
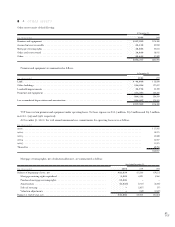
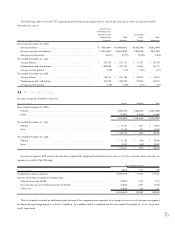
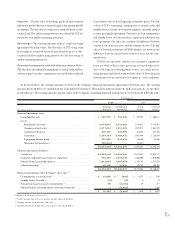
6>LOANS AND LEASES
Loans and leases consist of the following:
At December 31,
(In thousands) 2000 1999
Residential real estate . . . . . . . . . . . . . . . . . . . . . . . . . . . . . . . . . . . . . . . . . . . . . . . . . . . . . . . . . . . . $3,666,765 $3,911,184
Unearned premiums and deferred loan fees . . . . . . . . . . . . . . . . . . . . . . . . . . . . . . . . . . . . . . . . . . . .7,066 8,494
3,673,831 3,919,678
Consumer:
Home equity . . . . . . . . . . . . . . . . . . . . . . . . . . . . . . . . . . . . . . . . . . . . . . . . . . . . . . . . . . . . . . . . 2,168,827 1,974,924
Automobile . . . . . . . . . . . . . . . . . . . . . . . . . . . . . . . . . . . . . . . . . . . . . . . . . . . . . . . . . . . . . . . . 38,138 55,271
Loans secured by deposits . . . . . . . . . . . . . . . . . . . . . . . . . . . . . . . . . . . . . . . . . . . . . . . . . . . . . . . 6,881 6,859
Other secured . . . . . . . . . . . . . . . . . . . . . . . . . . . . . . . . . . . . . . . . . . . . . . . . . . . . . . . . . . . . . . . 11,900 11,148
Unsecured . . . . . . . . . . . . . . . . . . . . . . . . . . . . . . . . . . . . . . . . . . . . . . . . . . . . . . . . . . . . . . . . . 25,175 26,634
Unearned discounts and deferred loan fees . . . . . . . . . . . . . . . . . . . . . . . . . . . . . . . . . . . . . . . . . . (16,787) (16,252)
2,234,134 2,058,584
Commercial real estate:
Apartments . . . . . . . . . . . . . . . . . . . . . . . . . . . . . . . . . . . . . . . . . . . . . . . . . . . . . . . . . . . . . . . . . 324,666 276,045
Other permanent . . . . . . . . . . . . . . . . . . . . . . . . . . . . . . . . . . . . . . . . . . . . . . . . . . . . . . . . . . . . 871,614 637,980
Construction and development . . . . . . . . . . . . . . . . . . . . . . . . . . . . . . . . . . . . . . . . . . . . . . . . . .178,372 162,570
Unearned discounts and deferred loan fees . . . . . . . . . . . . . . . . . . . . . . . . . . . . . . . . . . . . . . . . . . (2,811) (3,123)
1,371,841 1,073,472
Commercial business . . . . . . . . . . . . . . . . . . . . . . . . . . . . . . . . . . . . . . . . . . . . . . . . . . . . . . . . . . . . 409,915 350,816
Deferred loan costs . . . . . . . . . . . . . . . . . . . . . . . . . . . . . . . . . . . . . . . . . . . . . . . . . . . . . . . . . . . . . . 507 537
410,422 351,353
Leasing and equipment finance:
Loans:
Equipment finance loans . . . . . . . . . . . . . . . . . . . . . . . . . . . . . . . . . . . . . . . . . . . . . . . . . . . . 204,351 43,647
Deferred loan costs . . . . . . . . . . . . . . . . . . . . . . . . . . . . . . . . . . . . . . . . . . . . . . . . . . . . . . . . . 2,708 513
207,059 44,160
Lease financings:
Direct financing leases . . . . . . . . . . . . . . . . . . . . . . . . . . . . . . . . . . . . . . . . . . . . . . . . . . . . . . 658,678 446,351
Sales-type leases . . . . . . . . . . . . . . . . . . . . . . . . . . . . . . . . . . . . . . . . . . . . . . . . . . . . . . . . . . . 37,645 30,387
Lease residuals . . . . . . . . . . . . . . . . . . . . . . . . . . . . . . . . . . . . . . . . . . . . . . . . . . . . . . . . . . . . 30,426 24,384
Unearned income and deferred lease costs . . . . . . . . . . . . . . . . . . . . . . . . . . . . . . . . . . . . . . . . (94,506) (52,626)
Investment in leveraged leases . . . . . . . . . . . . . . . . . . . . . . . . . . . . . . . . . . . . . . . . . . . . . . . . .17,169 –
649,412 448,496
856,471 492,656
$8,546,699 $7,895,743
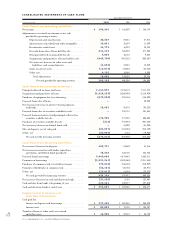
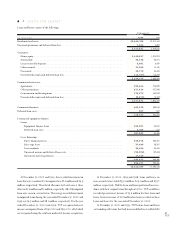
At December 31, 2000 and 1999, the recorded investment in
loans that were considered to be impaired was $6.1 million and $4.5
million, respectively. The related allowance for loan losses at those
dates was $1.2 million and $1 million, respectively. All of the impaired
loans were on non-accrual status. The average recorded investment
in impaired loans during the year ended December 31, 2000 and
1999 was $4.3 million and $8.1 million, respectively. For the year
ended December 31, 2000 and 1999, TCF recognized interest
income on impaired loans of $40,000 and $519,000, all of which
was recognized using the cash basis method of income recognition.
At December 31, 2000, 1999 and 1998, loans and leases on
non-accrual status totaled $35.2 million, $24.1 million and $33.7
million, respectively. Had the loans and leases performed in accor-
dance with their original terms throughout 2000, TCF would have
recorded gross interest income of $3.9 million for these loans and
leases. Interest income of $1.6 million has been recorded on these
loans and leases for the year ended December 31, 2000.
At December 31, 2000 and 1999, TCF had no loans and leases
outstanding with terms that had been modified in troubled debt