TCF Bank 2000 Annual Report Download - page 44
Download and view the complete annual report
Please find page 44 of the 2000 TCF Bank annual report below. You can navigate through the pages in the report by either clicking on the pages listed below, or by using the keyword search tool below to find specific information within the annual report.-
 1
1 -
2
-
3
-
4
-
5
-
6
-
7
-
8
-
9
-
10
-
11
-
12
-
13
-
14
-
15
-
16
-
17
-
18
-
19
-
20
-
21
-
22
-
23
-
24
-
25
-
26
-
27
-
28
-
29
-
30
-
31
-
32
-
33
-
 34
34 -
 35
35 -
 36
36 -
 37
37 -
 38
38 -
 39
39 -
 40
40 -
 41
41 -
 42
42 -
 43
43 -
 44
44 -
 45
45 -
 46
46 -
 47
47 -
 48
48 -
 49
49 -
 50
50 -
 51
51 -
 52
52 -
 53
53 -
 54
54 -
55
-
56
-
57
-
58
-
59
-
60
-
61
-
62
-
63
-
64
-
65
-
66
-
67
-
68
-
69
-
70
-
71
-
72
-
73
-
74
-
75
-
76
-
77
 |
 |

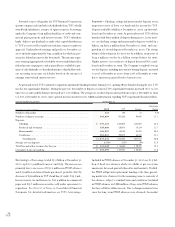
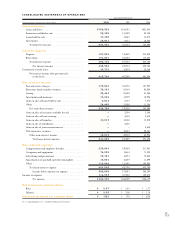
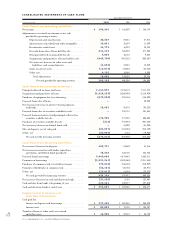
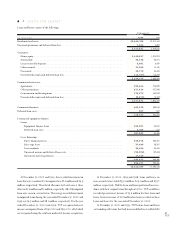
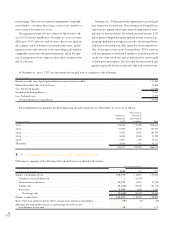
CONSOLIDATED STATEMENTS OF CASH FLOWS
Year Ended December 31,
(In thousands) 2000 1999 1998
Cash flows from operating activities:
Net income . . . . . . . . . . . . . . . . . . . . . . . . . . . . . . . . . . . $ 186,245 $ 166,039 $ 156,179
Adjustments to reconcile net income to net cash
provided by operating activities:
Depreciation and amortization . . . . . . . . . . . . . . . . 30,369 29,031 27,914
Amortization of goodwill and other intangibles . . . . 10,001 10,689 11,399
Provision for credit losses . . . . . . . . . . . . . . . . . . . . 14,772 16,923 23,280
Proceeds from sales of loans held for sale . . . . . . . . . 611,123 586,859 577,808
Principal collected on loans held for sale . . . . . . . . . 9,885 10,144 9,083
Originations and purchases of loans held for sale . . . (649,750) (457,515) (603,567)
Net (increase) decrease in other assets and
liabilities, and accrued interest . . . . . . . . . . . . . (1,854) 47,088 14,339
Gains on sales of assets . . . . . . . . . . . . . . . . . . . . . . (12,813) (23,952) (28,825)
Other, net . . . . . . . . . . . . . . . . . . . . . . . . . . . . . . . 4,125 14,988 8,395
Total adjustments . . . . . . . . . . . . . . . . . . . . . . . 15,858 234,255 39,826
Net cash provided by operating activities . . . . . . 202,103 400,294 196,005
Cash flows from investing activities:
Principal collected on loans and leases . . . . . . . . . . . . . . . 2,162,839 2,315,173 3,111,218
Originations and purchases of loans . . . . . . . . . . . . . . . . . (2,320,239) (3,069,408) (3,119,924)
Purchases of equipment for lease financing . . . . . . . . . . . . (579,595) (289,156) (186,009)
Proceeds from sales of loans . . . . . . . . . . . . . . . . . . . . . . . –– 20,330
Net (increase) decrease in interest-bearing deposits
with banks . . . . . . . . . . . . . . . . . . . . . . . . . . . . . . . . . 19,987 95,575 (95,322)
Proceeds from sales of securities available for sale . . . . . . . . –288,718 231,438
Proceeds from maturities of and principal collected on
securities available for sale . . . . . . . . . . . . . . . . . . . . . . 176,905 577,844 606,603
Purchases of securities available for sale . . . . . . . . . . . . . . . (314) (791,995) (967,585)
Net (increase) decrease in federal funds sold . . . . . . . . . . . –41,000 (41,000)
Sales of deposits, net of cash paid . . . . . . . . . . . . . . . . . . . (82,097) (104,404) (213,159)
Other, net . . . . . . . . . . . . . . . . . . . . . . . . . . . . . . . . . . . (53,000) 7,723 (19,956)
Net cash used by investing activities . . . . . . . . . . . . . . . (675,514) (928,930) (673,366)
Cash flows from financing activities:
Net increase (decrease) in deposits . . . . . . . . . . . . . . . . . . 402,731 (13,649) 41,816
Net increase in securities sold under repurchase
agreements and federal funds purchased . . . . . . . . . . . . 75,320 642,720 254,836
Proceeds from borrowings . . . . . . . . . . . . . . . . . . . . . . . . 5,443,008 4,679,462 3,502,311
Payments on borrowings . . . . . . . . . . . . . . . . . . . . . . . . . (5,331,961) (4,598,365) (2,911,853)
Purchases of common stock to be held in treasury . . . . . . . (73,824) (106,106) (210,939)
Payments of dividends on common stock . . . . . . . . . . . . . . (66,101) (60,755) (54,971)
Other, net . . . . . . . . . . . . . . . . . . . . . . . . . . . . . . . . . . . (13,017) (5,886) (20,372)
Net cash provided by financing activities . . . . . . . . . . . . 436,156 537,421 600,828
Net increase (decrease) in cash and due from banks . . . . . . (37,255) 8,785 123,467
Cash and due from banks at beginning of year . . . . . . . . . . 429,262 420,477 297,010
Cash and due from banks at end of year . . . . . . . . . . . . . . . $ 392,007 $ 429,262 $ 420,477
Supplemental disclosures of
cash flow information:
Cash paid for:
Interest on deposits and borrowings . . . . . . . . . . . . . . . $ 377,430 $ 302,268 $ 306,299
Income taxes . . . . . . . . . . . . . . . . . . . . . . . . . . . . . . . $ 89,852 $ 78,125 $ 105,207
Transfer of loans to other real estate owned
and other assets . . . . . . . . . . . . . . . . . . . . . . . . . . . . . $ 16,580 $ 32,074 $ 36,750
See accompanying notes to consolidated financial statements.
42
TCF