TCF Bank 2000 Annual Report Download - page 62
Download and view the complete annual report
Please find page 62 of the 2000 TCF Bank annual report below. You can navigate through the pages in the report by either clicking on the pages listed below, or by using the keyword search tool below to find specific information within the annual report.-
 1
1 -
2
-
3
-
4
-
5
-
6
-
7
-
8
-
9
-
10
-
11
-
12
-
13
-
14
-
15
-
16
-
17
-
18
-
19
-
20
-
21
-
22
-
23
-
24
-
25
-
26
-
27
-
28
-
29
-
30
-
31
-
32
-
33
-
34
-
35
-
36
-
37
-
38
-
39
-
40
-
41
-
42
-
43
-
44
-
45
-
46
-
47
-
48
-
49
-
50
-
51
-
 52
52 -
 53
53 -
 54
54 -
 55
55 -
 56
56 -
 57
57 -
 58
58 -
 59
59 -
 60
60 -
 61
61 -
 62
62 -
 63
63 -
 64
64 -
 65
65 -
 66
66 -
 67
67 -
 68
68 -
 69
69 -
 70
70 -
 71
71 -
 72
72 -
73
-
74
-
75
-
76
-
77
 |
 |

60
TCF
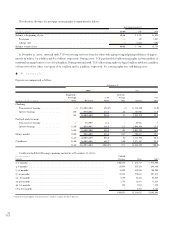
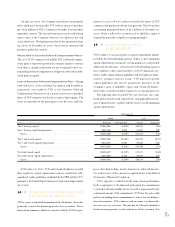
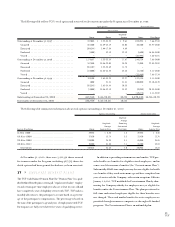
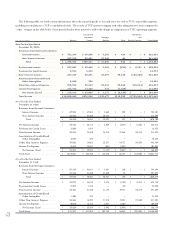
The following table sets forth the status of the Pension Plan and the Postretirement Plan at the dates indicated:
Pension Plan Postretirement Plan
Year Ended December 31, Year Ended December 31,
(In thousands) 2000 1999 2000 1999
Change in benefit obligation:
Benefit obligation at beginning of year . . . . . . . . . . . . . . . . . . . . . $ 30,728 $ 28,967 $ 9,721 $ 9,214
Service cost – benefits earned during the year . . . . . . . . . . . . . . . . . 3,248 3,297 56 426
Interest cost on benefit obligation . . . . . . . . . . . . . . . . . . . . . . . . . 2,431 2,059 523 630
Amendments . . . . . . . . . . . . . . . . . . . . . . . . . . . . . . . . . . . . . . . . ––(2,481) –
Actuarial (gain) loss . . . . . . . . . . . . . . . . . . . . . . . . . . . . . . . . . . . (1,942) (1,205) 179 69
Benefits paid . . . . . . . . . . . . . . . . . . . . . . . . . . . . . . . . . . . . . . . . (1,921) (2,390) (389) (618)
Benefit obligation at end of year . . . . . . . . . . . . . . . . . . . . . . . . 32,544 30,728 7,609 9,721
Change in fair value of plan assets:
Fair value of plan assets at beginning of year . . . . . . . . . . . . . . . . . . 74,867 57,338 ––
Actual return on plan assets . . . . . . . . . . . . . . . . . . . . . . . . . . . . . 14,118 18,151 ––
Benefits paid . . . . . . . . . . . . . . . . . . . . . . . . . . . . . . . . . . . . . . . . (1,921) (2,390) (389) (618)
Plan merger . . . . . . . . . . . . . . . . . . . . . . . . . . . . . . . . . . . . . . . . . –1,768 ––
Employer contributions . . . . . . . . . . . . . . . . . . . . . . . . . . . . . . . . ––389 618
Fair value of plan assets at end of year . . . . . . . . . . . . . . . . . . . . 87,064 74,867 ––
Funded status of plans:
Funded status at end of year . . . . . . . . . . . . . . . . . . . . . . . . . . . . . 54,520 44,139 (7,609) (9,721)
Unrecognized transition obligation . . . . . . . . . . . . . . . . . . . . . . . . ––2,513 4,433
Unrecognized prior service cost . . . . . . . . . . . . . . . . . . . . . . . . . . (2,926) (3,983) –770
Unrecognized net gain . . . . . . . . . . . . . . . . . . . . . . . . . . . . . . . . . (32,808) (23,870) (797) (998)
Prepaid (accrued) benefit cost at end of year . . . . . . . . . . . . . . . $ 18,786 $ 16,286 $(5,893) $(5,516)
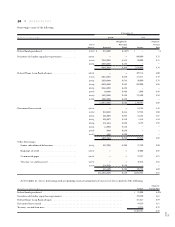
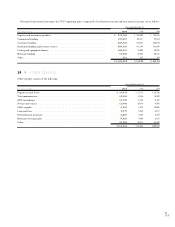
Net periodic benefit cost (credit) included the following components:
Pension Plan Postretirement Plan
Year Ended December 31, Year Ended December 31,
(In thousands) 2000 1999 1998 2000 1999 1998
Service cost . . . . . . . . . . . . . . . . . . . . $ 3,248 $ 3,297 $ 2,967 $56 $ 426 $ 299
Interest cost . . . . . . . . . . . . . . . . . . . 2,431 2,059 1,454 523 630 641
Expected return on plan assets . . . . . . (6,207) (5,155) (3,745) –––
Amortization of transition obligation . . –––209 342 342
Amortization of prior service cost . . . . (1,057) (1,057) (876) –109 109
Recognized actuarial gain . . . . . . . . . . (915) – (728) (22) (12) (58)
Net periodic benefit cost (credit) . . $(2,500) $ (856) $ (928) $766 $1,495 $1,333
The discount rate and rate of increase in future compensation used to measure the benefit obligation and the expected long-term rate of
return on plan assets were as follows:
Pension Plan Postretirement Plan
Year Ended December 31, Year Ended December 31,
2000 1999 1998 2000 1999 1998
Discount rate . . . . . . . . . . . . . . . . . . 7.50% 7.50% 6.75% 7.50% 7.50% 6.75%
Rate of increase in future
compensation . . . . . . . . . . . . . . . 5.00 5.00 5.00 –––
Expected long-term rate of return
on plan assets . . . . . . . . . . . . . . . . 10.00 10.00 9.50 –––