TCF Bank 2000 Annual Report Download - page 41
Download and view the complete annual report
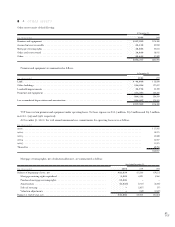
Please find page 41 of the 2000 TCF Bank annual report below. You can navigate through the pages in the report by either clicking on the pages listed below, or by using the keyword search tool below to find specific information within the annual report.-
 1
1 -
2
-
3
-
4
-
5
-
6
-
7
-
8
-
9
-
10
-
11
-
12
-
13
-
14
-
15
-
16
-
17
-
18
-
19
-
20
-
21
-
22
-
23
-
24
-
25
-
26
-
27
-
28
-
29
-
30
-
 31
31 -
 32
32 -
 33
33 -
 34
34 -
 35
35 -
 36
36 -
 37
37 -
 38
38 -
 39
39 -
 40
40 -
 41
41 -
 42
42 -
 43
43 -
 44
44 -
 45
45 -
 46
46 -
 47
47 -
 48
48 -
 49
49 -
 50
50 -
 51
51 -
52
-
53
-
54
-
55
-
56
-
57
-
58
-
59
-
60
-
61
-
62
-
63
-
64
-
65
-
66
-
67
-
68
-
69
-
70
-
71
-
72
-
73
-
74
-
75
-
76
-
77
 |
 |

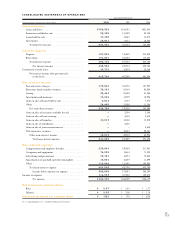
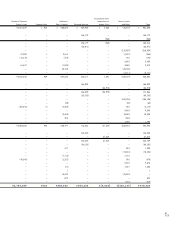
CONSOLIDATED STATEMENTS OF OPERATIONS
Year Ended December 31,
(In thousands, except per-share data) 2000 1999 1998
Interest income:
Loans and leases . . . . . . . . . . . . . . . . . . . . . . . . . . . . . $700,325 $618,291 $631,342
Securities available for sale . . . . . . . . . . . . . . . . . . . . . 99,185 111,032 93,124
Loans held for sale . . . . . . . . . . . . . . . . . . . . . . . . . . . 17,130 13,367 14,072
Investments . . . . . . . . . . . . . . . . . . . . . . . . . . . . . . . . 10,041 9,411 10,356
Total interest income . . . . . . . . . . . . . . . . . . . . . . . 826,681 752,101 748,894
Interest expense:
Deposits . . . . . . . . . . . . . . . . . . . . . . . . . . . . . . . . . . 197,094 175,495 212,492
Borrowings . . . . . . . . . . . . . . . . . . . . . . . . . . . . . . . . 191,051 152,393 110,668
Total interest expense . . . . . . . . . . . . . . . . . . . . . . 388,145 327,888 323,160
Net interest income . . . . . . . . . . . . . . . . . . . . . 438,536 424,213 425,734
Provision for credit losses . . . . . . . . . . . . . . . . . . . . . . . . 14,772 16,923 23,280
Net interest income after provision for
credit losses . . . . . . . . . . . . . . . . . . . . . . . . . . . 423,764 407,290 402,454
Non-interest income:
Fees and service charges . . . . . . . . . . . . . . . . . . . . . . . 179,563 151,972 127,952
Electronic funds transfer revenues . . . . . . . . . . . . . . . . 78,101 67,144 50,556
Leasing . . . . . . . . . . . . . . . . . . . . . . . . . . . . . . . . . . . 38,442 28,505 31,344
Investments and insurance . . . . . . . . . . . . . . . . . . . . . 12,266 14,849 13,926
Gain on sales of loans held for sale . . . . . . . . . . . . . . . 4,012 4,747 7,575
Other . . . . . . . . . . . . . . . . . . . . . . . . . . . . . . . . . . . . 16,405 12,009 11,156
Fees and other revenues . . . . . . . . . . . . . . . . . . . . . 328,789 279,226 242,509
Gain on sales of securities available for sale . . . . . . . . . . –3,194 2,246
Gain on sales of loan servicing . . . . . . . . . . . . . . . . . . . –3,076 2,414
Gain on sales of branches . . . . . . . . . . . . . . . . . . . . . . 12,813 12,160 18,585
Gain on sale of subsidiaries . . . . . . . . . . . . . . . . . . . . . –5,522 –
Gain on sale of joint venture interest . . . . . . . . . . . . . . –– 5,580
Title insurance revenues . . . . . . . . . . . . . . . . . . . . . . . –15,421 20,161
Other non-interest income . . . . . . . . . . . . . . . . . . 12,813 39,373 48,986
Total non-interest income . . . . . . . . . . . . . . . . 341,602 318,599 291,495
Non-interest expense:
Compensation and employee benefits . . . . . . . . . . . . . 239,544 239,053 217,401
Occupancy and equipment . . . . . . . . . . . . . . . . . . . . . 74,938 73,613 71,323
Advertising and promotions . . . . . . . . . . . . . . . . . . . . 19,181 16,981 19,544
Amortization of goodwill and other intangibles . . . . . . 10,001 10,689 11,399
Other . . . . . . . . . . . . . . . . . . . . . . . . . . . . . . . . . . . . 118,864 112,462 109,033
Total non-interest expense . . . . . . . . . . . . . . . . . . . 462,528 452,798 428,700
Income before income tax expense . . . . . . . . . . . 302,838 273,091 265,249
Income tax expense . . . . . . . . . . . . . . . . . . . . . . . . . . . . . 116,593 107,052 109,070
Net income . . . . . . . . . . . . . . . . . . . . . . . . . . . $186,245 $166,039 $156,179
Net income per common share:
Basic . . . . . . . . . . . . . . . . . . . . . . . . . . . . . . . . . . . . . $ 2.37 $ 2.01 $ 1.77
Diluted . . . . . . . . . . . . . . . . . . . . . . . . . . . . . . . . . . . $ 2.35 $ 2.00 $ 1.76
Dividends declared per common share . . . . . . $ .825 $ .725 $ .6125
See accompanying notes to consolidated financial statements.
39
TCF