TCF Bank 2000 Annual Report Download - page 53
Download and view the complete annual report
Please find page 53 of the 2000 TCF Bank annual report below. You can navigate through the pages in the report by either clicking on the pages listed below, or by using the keyword search tool below to find specific information within the annual report.-
 1
1 -
2
-
3
-
4
-
5
-
6
-
7
-
8
-
9
-
10
-
11
-
12
-
13
-
14
-
15
-
16
-
17
-
18
-
19
-
20
-
21
-
22
-
23
-
24
-
25
-
26
-
27
-
28
-
29
-
30
-
31
-
32
-
33
-
34
-
35
-
36
-
37
-
38
-
39
-
40
-
41
-
42
-
 43
43 -
 44
44 -
 45
45 -
 46
46 -
 47
47 -
 48
48 -
 49
49 -
 50
50 -
 51
51 -
 52
52 -
 53
53 -
 54
54 -
 55
55 -
 56
56 -
 57
57 -
 58
58 -
 59
59 -
 60
60 -
 61
61 -
 62
62 -
 63
63 -
64
-
65
-
66
-
67
-
68
-
69
-
70
-
71
-
72
-
73
-
74
-
75
-
76
-
77
 |
 |

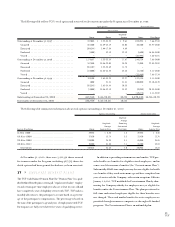
51
TCF
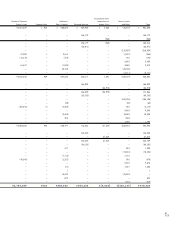
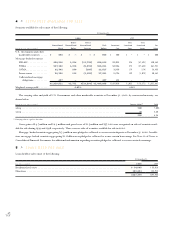
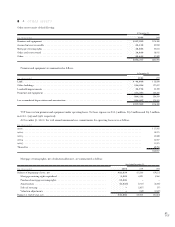
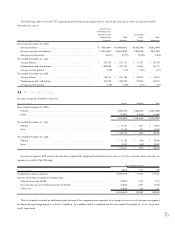
10 >BORROWINGS
Borrowings consist of the following:
At December 31,
(Dollars in thousands) 2000 1999
Weighted- Weighted-
Year of Average Average
Maturity Amount Rate Amount Rate
Federal funds purchased . . . . . . . . . . . . . . . . . . . . . . . . . 2001 $ 91,000 6.49% $– –%
Securities sold under repurchase agreements . . . . . . . . . . 2000 ––960,000 5.75
2001 794,320 6.61 50,000 5.71
2005 200,000 6.27 ––
994,320 6.54 1,010,000 5.74
Federal Home Loan Bank advances . . . . . . . . . . . . . . . . . 2000 ––499,716 6.00
2001 481,537 5.89 181,571 5.79
2003 135,000 5.76 50,000 5.78
2004 803,000 5.69 903,000 5.55
2005 246,000 6.02 ––
2006 3,000 5.48 3,000 5.46
2009 122,500 5.25 122,500 5.24
2010 100,000 6.02 ––
1,891,037 5.78 1,759,787 5.69
Discounted lease rentals . . . . . . . . . . . . . . . . . . . . . . . . . 2000 ––83,785 8.43
2001 84,529 8.81 57,285 8.50
2002 48,369 8.96 23,284 8.67
2003 20,897 9.10 8,816 8.84
2004 10,114 9.22 5,199 8.92
2005 1,355 9.15 ––
2006 390 8.25 ––
2007 109 8.36 ––
165,763 8.92 178,369 8.52
Other borrowings:
Senior subordinated debentures . . . . . . . . . . . . . . . . . 2003 28,750 9.50 28,750 9.50
Bank line of credit . . . . . . . . . . . . . . . . . . . . . . . . . . . 2000 ––42,000 6.92
Commercial paper . . . . . . . . . . . . . . . . . . . . . . . . . . 2000 ––22,357 6.21
Treasury, tax and loan note . . . . . . . . . . . . . . . . . . . . 2000 ––42,625 4.53
2001 13,375 5.73 ––
42,125 8.30 135,732 6.60
$3,184,245 6.23 $3,083,888 5.91
At December 31, 2000, borrowings with a remaining contractual maturity of one year or less consisted of the following:
Weighted-
(Dollars in thousands) Amount Average Rate
Federal funds purchased . . . . . . . . . . . . . . . . . . . . . . . . . . . . . . . . . . . . . . . . . . . . . . . . . . . . . . . . . . $ 91,000 6.49%
Securities sold under repurchase agreements . . . . . . . . . . . . . . . . . . . . . . . . . . . . . . . . . . . . . . . . . . . 794,320 6.61
Federal Home Loan Bank advances . . . . . . . . . . . . . . . . . . . . . . . . . . . . . . . . . . . . . . . . . . . . . . . . . . 481,537 5.89
Discounted lease rentals . . . . . . . . . . . . . . . . . . . . . . . . . . . . . . . . . . . . . . . . . . . . . . . . . . . . . . . . . . 84,529 8.81
Treasury, tax and loan note . . . . . . . . . . . . . . . . . . . . . . . . . . . . . . . . . . . . . . . . . . . . . . . . . . . . . . . . 13,375 5.73
$1,464,761 6.48