TCF Bank 2000 Annual Report Download - page 55
Download and view the complete annual report
Please find page 55 of the 2000 TCF Bank annual report below. You can navigate through the pages in the report by either clicking on the pages listed below, or by using the keyword search tool below to find specific information within the annual report.-
 1
1 -
2
-
3
-
4
-
5
-
6
-
7
-
8
-
9
-
10
-
11
-
12
-
13
-
14
-
15
-
16
-
17
-
18
-
19
-
20
-
21
-
22
-
23
-
24
-
25
-
26
-
27
-
28
-
29
-
30
-
31
-
32
-
33
-
34
-
35
-
36
-
37
-
38
-
39
-
40
-
41
-
42
-
43
-
44
-
 45
45 -
 46
46 -
 47
47 -
 48
48 -
 49
49 -
 50
50 -
 51
51 -
 52
52 -
 53
53 -
 54
54 -
 55
55 -
 56
56 -
 57
57 -
 58
58 -
 59
59 -
 60
60 -
 61
61 -
 62
62 -
 63
63 -
 64
64 -
 65
65 -
66
-
67
-
68
-
69
-
70
-
71
-
72
-
73
-
74
-
75
-
76
-
77
 |
 |

53
TCF
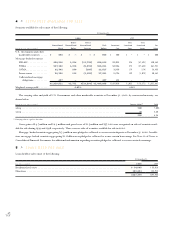
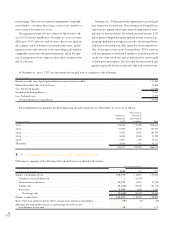
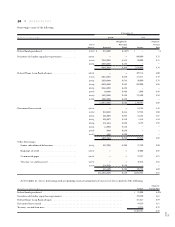
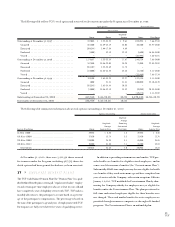
The following table sets forth TCF’s maximum and average borrowing levels for each of the years in the three-year period ended
December 31, 2000:
Securities Sold
Under Repurchase
Agreements and Discounted
Federal Funds FHLB Lease Other
(Dollars in thousands) Purchased Advances Rentals Borrowings
Year ended December 31, 2000:
Average balance . . . . . . . . . . . . . . . . . . . . . . . . . . . . . . . . . . . . . . . . . . . . . . . . . . $ 925,004 $1,888,892 $163,758 $121,048
Maximum month-end balance . . . . . . . . . . . . . . . . . . . . . . . . . . . . . . . . . . . . . . 1,151,913 2,016,040 172,348 296,750
Average rate for period . . . . . . . . . . . . . . . . . . . . . . . . . . . . . . . . . . . . . . . . . . . . 6.34% 5.79% 8.55% 7.44%
Year ended December 31, 1999:
Average balance . . . . . . . . . . . . . . . . . . . . . . . . . . . . . . . . . . . . . . . . . . . . . . . . . . . $ 529,359 $ 1,821,172 $ 171,997 $ 151,430
Maximum month-end balance . . . . . . . . . . . . . . . . . . . . . . . . . . . . . . . . . . . . . . 1,010,000 1,997,346 182,456 367,177
Average rate for period . . . . . . . . . . . . . . . . . . . . . . . . . . . . . . . . . . . . . . . . . . . . . 5.40% 5.52% 8.04% 6.27%
Year ended December 31, 1998:
Average balance . . . . . . . . . . . . . . . . . . . . . . . . . . . . . . . . . . . . . . . . . . . . . . . . . . . $ 140,414 $ 1,367,104 $ 205,393 $ 92,467
Maximum month-end balance . . . . . . . . . . . . . . . . . . . . . . . . . . . . . . . . . . . . . . 367,280 1,804,208 222,018 214,087
Average rate for period . . . . . . . . . . . . . . . . . . . . . . . . . . . . . . . . . . . . . . . . . . . . . 5.60% 5.80% 8.15% 7.38%
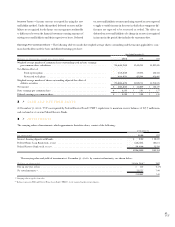
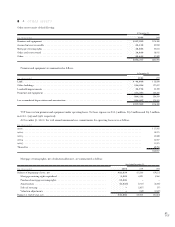
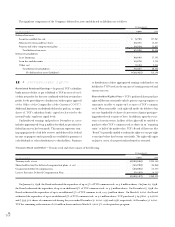
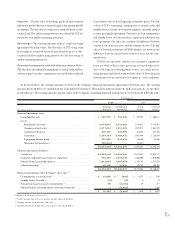
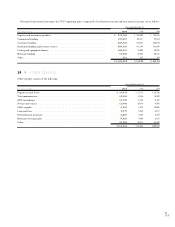
11 >INCOME TAXES
Income tax expense (benefit) consists of:
(In thousands) Current Deferred Total
Year ended December 31, 2000:
Federal . . . . . . . . . . . . . . . . . . . . . . . . . . . . . . . . . . . . . . . . . . . . . . . . . . . . . . . . $88,746 $18,862 $107,608
State . . . . . . . . . . . . . . . . . . . . . . . . . . . . . . . . . . . . . . . . . . . . . . . . . . . . . . . . . 6,457 2,528 8,985
$95,203 $21,390 $116,593
Year ended December 31, 1999:
Federal . . . . . . . . . . . . . . . . . . . . . . . . . . . . . . . . . . . . . . . . . . . . . . . . . . . . . . . . $ 91,647 $ 2,981 $ 94,628
State . . . . . . . . . . . . . . . . . . . . . . . . . . . . . . . . . . . . . . . . . . . . . . . . . . . . . . . . . . 11,747 677 12,424
$ 103,394 $ 3,658 $ 107,052
Year ended December 31, 1998:
Federal . . . . . . . . . . . . . . . . . . . . . . . . . . . . . . . . . . . . . . . . . . . . . . . . . . . . . . . . $ 91,102 $ (994) $ 90,108
State . . . . . . . . . . . . . . . . . . . . . . . . . . . . . . . . . . . . . . . . . . . . . . . . . . . . . . . . . . 19,325 (363) 18,962
$ 110,427 $ (1,357) $ 109,070
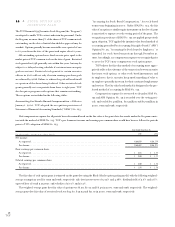
Income tax expense differs from the amounts computed by applying the federal income tax rate of 35% to income before income tax
expense as a result of the following:
Year Ended December 31,
(In thousands) 2000 1999 1998
Computed income tax expense . . . . . . . . . . . . . . . . . . . . . . . . . . . . . . . . . . . . . . . . . . $105,993 $ 95,582 $ 92,837
Increase in income tax expense resulting from:
Amortization of goodwill . . . . . . . . . . . . . . . . . . . . . . . . . . . . . . . . . . . . . . . . . . . 2,544 2,724 3,741
State income tax, net of federal income tax benefit . . . . . . . . . . . . . . . . . . . . . . . . . 5,840 8,076 12,325
Other, net . . . . . . . . . . . . . . . . . . . . . . . . . . . . . . . . . . . . . . . . . . . . . . . . . . . . . 2,216 670 167
$116,593 $107,052 $109,070
The tax benefit recorded in additional paid-in capital for compensation expense for tax purposes in excess of amounts recognized
for financial reporting purposes totaled $1.5 million, $4.1 million and $2.4 million for the years ended December 31, 2000, 1999 and,
1998, respectively.