TCF Bank 2000 Annual Report Download - page 30
Download and view the complete annual report
Please find page 30 of the 2000 TCF Bank annual report below. You can navigate through the pages in the report by either clicking on the pages listed below, or by using the keyword search tool below to find specific information within the annual report.-
 1
1 -
2
-
3
-
4
-
5
-
6
-
7
-
8
-
9
-
10
-
11
-
12
-
13
-
14
-
15
-
16
-
17
-
18
-
19
-
 20
20 -
 21
21 -
 22
22 -
 23
23 -
 24
24 -
 25
25 -
 26
26 -
 27
27 -
 28
28 -
 29
29 -
 30
30 -
 31
31 -
 32
32 -
 33
33 -
 34
34 -
 35
35 -
 36
36 -
 37
37 -
 38
38 -
 39
39 -
 40
40 -
41
-
42
-
43
-
44
-
45
-
46
-
47
-
48
-
49
-
50
-
51
-
52
-
53
-
54
-
55
-
56
-
57
-
58
-
59
-
60
-
61
-
62
-
63
-
64
-
65
-
66
-
67
-
68
-
69
-
70
-
71
-
72
-
73
-
74
-
75
-
76
-
77
 |
 |

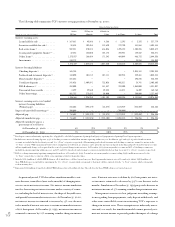
Amortization of goodwill and other intangibles decreased
$688,000 in 2000 and $710,000 in 1999. The decrease in 2000
was primarily due to reduced amortization of deposit base intan-
gibles. The write-off of goodwill associated with branch sales, which
is reported as a component of gain on sales of branches, totaled
$464,000 in 1999 and $3.3 million in 1998. No such write-offs
occurred during 2000.
Other non-interest expense increased $6.4 million, or 5.7%,
in 2000 and $3.4 million, or 3.1%, in 1999. The increases pri-
marily reflect costs associated with expanded retail banking and
leasing activities, including increases in deposit account losses. A
summary of other expense is presented in Note 19 of Notes to
Consolidated Financial Statements.
Income Taxes – TCF recorded income tax expense of $116.6
million in 2000, compared with $107.1 million in 1999 and
$109.1 million in 1998. Income tax expense represented 38.5%
of income before income tax expense during 2000, compared
with 39.2% and 41.1% in 1999 and 1998, respectively. The lower
tax rates in 2000 and 1999 reflect lower state income taxes, and
the impact of relatively lower non-deductible expenses.
Further detail on income taxes is provided in Note 11 of Notes
to Consolidated Financial Statements.
CONSOLIDATED FINANCIAL
CONDITION ANALYSIS
Investments – Total investments, which include interest-bear-
ing deposits with banks, federal funds sold, FHLB stock, Federal
Reserve Bank stock and other investments, decreased $14.1 mil-
lion in 2000 to $134.1 million at December 31, 2000. The
decrease primarily reflects a decrease of $20 million in interest-
bearing deposits with banks, partially offset by an increase of $5.8
million in FHLB stock. TCF had no non-investment grade debt
securities (junk bonds) and there were no open trading account
or investment option positions as of December 31, 2000. TCF is
required to invest in FHLB stock in proportion to its level of bor-
rowings from the FHLB.
Securities Available for Sale – Securities available for sale
are carried at fair value with the unrealized gains or losses, net of
deferred income taxes, reported as accumulated other compre-
hensive income (loss), which is a separate component of stock-
holders’ equity. Securities available for sale decreased $117.8 million
during 2000 to $1.4 billion at December 31, 2000. The decrease
reflects payment and prepayment activity, partially offset by pur-
chases of $314,000 of securities available for sale. At December
31, 2000, TCF’s securities available-for-sale portfolio included
$1.3 billion and $85.8 million of fixed-rate and adjustable-rate
mortgage-backed securities, respectively. Securities available for
sale totaled $1.5 billion at December 31, 1999. Net unrealized pre-
tax losses on securities available for sale totaled $15.6 million at
December 31, 2000, compared with net unrealized pre-tax losses
of $75.3 million at December 31, 1999. TCF has no plans to sell
these securities and it is not anticipated that these unrealized losses
will be realized.
Loans Held for Sale – Residential real estate and education
loans held for sale are carried at the lower of cost or market.
Education loans held for sale increased $9.3 million and resi-
dential real estate loans held for sale increased $19.5 million from
year-end 1999, and totaled $153.2 million and $74.5 million,
respectively, at December 31, 2000. As previously noted, $139.4
million of consumer finance automobile loans and $14.8 million
of related allowances were transferred to loans held for sale dur-
ing 1999 and were subsequently sold during 1999. There were no
consumer finance automobile loans classified as held for sale at
December 31, 2000. See “Loans and Leases.”
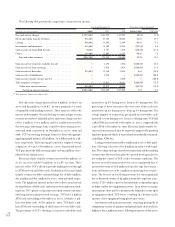
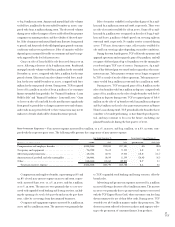
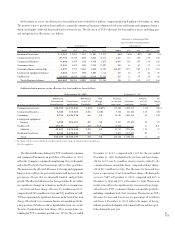
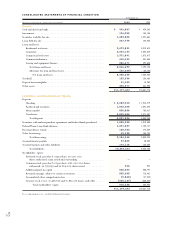
Loans and Leases – The following table sets forth information about loans and leases held in TCF’s portfolio, excluding loans held for sale:
At December 31,
(In thousands) 2000 1999 1998 1997 1996
Residential real estate . . . . . . . . . . . . . . . . . . . . . . . . $ 3,673,831 $3,919,678 $3,765,280 $ 3,623,845 $2,252,312
Consumer . . . . . . . . . . . . . . . . . . . . . . . . . . . . . . . . 2,234,134 2,058,584 1,876,554 1,976,699 1,728,368
Commercial real estate . . . . . . . . . . . . . . . . . . . . . . . 1,371,841 1,073,472 811,428 859,916 858,225
Commercial business . . . . . . . . . . . . . . . . . . . . . . . . . 410,422 351,353 289,104 240,207 157,057
Leasing and equipment finance . . . . . . . . . . . . . . . . . 856,471 492,656 398,812 368,521 296,958
Total loans and leases . . . . . . . . . . . . . . . . . . . . $ 8,546,699 $7,895,743 $7,141,178 $ 7,069,188 $5,292,920
28
TCF