TCF Bank 2000 Annual Report Download - page 38
Download and view the complete annual report
Please find page 38 of the 2000 TCF Bank annual report below. You can navigate through the pages in the report by either clicking on the pages listed below, or by using the keyword search tool below to find specific information within the annual report.-
 1
1 -
2
-
3
-
4
-
5
-
6
-
7
-
8
-
9
-
10
-
11
-
12
-
13
-
14
-
15
-
16
-
17
-
18
-
19
-
20
-
21
-
22
-
23
-
24
-
25
-
26
-
27
-
 28
28 -
 29
29 -
 30
30 -
 31
31 -
 32
32 -
 33
33 -
 34
34 -
 35
35 -
 36
36 -
 37
37 -
 38
38 -
 39
39 -
 40
40 -
 41
41 -
 42
42 -
 43
43 -
 44
44 -
 45
45 -
 46
46 -
 47
47 -
 48
48 -
49
-
50
-
51
-
52
-
53
-
54
-
55
-
56
-
57
-
58
-
59
-
60
-
61
-
62
-
63
-
64
-
65
-
66
-
67
-
68
-
69
-
70
-
71
-
72
-
73
-
74
-
75
-
76
-
77
 |
 |

36
TCF
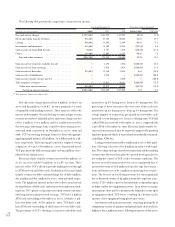
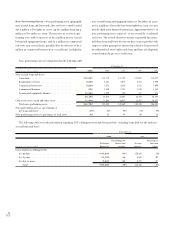
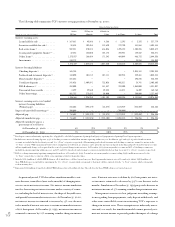
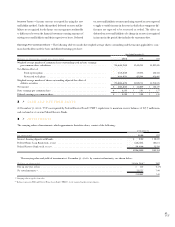
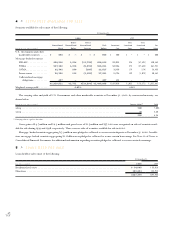
The following table summarizes TCF’s interest-rate gap position at December 31, 2000:
Maturity/Rate Sensitivity
Within 30 Days to 6 Months to
(Dollars in thousands) 30 Days 6 Months 1 Year 1 to 3 Years 3+ Years Total
Interest-earning assets:
Loans held for sale . . . . . . . . . . . . $ 167,861 $ 45,966 $ 8,366 $ 2,393 $ 3,193 $ 227,779
Securities available for sale (1) . . . . . 26,434 102,458 113,620 279,790 881,586 1,403,888
Real estate loans (1) . . . . . . . . . . . . . 559,281 570,888 616,026 1,495,122 1,804,355 5,045,672
Leasing and equipment finance (1) . . 32,883 143,060 158,175 392,921 129,432 856,471
Other loans (1) . . . . . . . . . . . . . . . . 1,375,937 166,454 171,343 464,089 466,733 2,644,556
Investments . . . . . . . . . . . . . . . . . 110,773–––23,286 134,059
2,273,169 1,028,826 1,067,530 2,634,315 3,308,585 10,312,425
Interest-bearing liabilities:
Checking deposits (2) . . . . . . . . . . . 165,755–––2,038,188 2,203,943
Passbook and statement deposits(2) . 144,090 101,812 107,111 302,914 389,461 1,045,388
Money market deposits(3) . . . . . . . 441,643–––395,245 836,888
Certificate deposits . . . . . . . . . . . . 241,426 1,409,891 723,036 402,511 28,741 2,805,605
FHLB advances (4) . . . . . . . . . . . . . 353,000 – 181,537 293,500 1,063,000 1,891,037
Discounted lease rentals . . . . . . . . 8,899 39,560 39,424 61,471 16,409 165,763
Other borrowings . . . . . . . . . . . . . 501,753 375,692 50,000 – 200,000 1,127,445
1,856,566 1,926,955 1,101,108 1,060,396 4,131,044 10,076,069
Interest-earning assets over (under)
interest-bearing liabilities
(Primary gap) . . . . . . . . . . . . . . . . 416,603 (898,129) (33,578) 1,573,919 (822,459) 236,356
Impact of unsettled borrowings (5) . . . . 300,000 – – (300,000) – –
Adjusted gap . . . . . . . . . . . . . . . . . . $ 716,603 $ (898,129) $ (33,578) $1,273,919 $ (822,459) $ 236,356
Adjusted cumulative gap . . . . . . . . . . . $ 716,603 $ (181,526) $ (215,104) $ 1,058,815 $ 236,356 $ 236,356
Adjusted cumulative gap as a
percentage of total assets:
At December 31, 2000 . . . . . . 6% (2)% (2)% 9% 2% 2%
At December 31, 1999 . . . . . . . 7% (7)% (10)% (9)% 2% 2%
(1) Based upon contractual maturity, repricing date, if applicable, scheduled repayments of principal and projected prepayments of principal based upon experience.
(2) Includes non-interest bearing deposits. 7.5% of checking accounts are included in amounts repricing within one year. In addition, 34% and 29% of passbook and statement
accounts are included in the less than 1 year and “1 to 3 Years” categories, respectively. All remaining passbook and statement and checking accounts are assumed to mature in the
“3+ Years” category. While management believes these assumptions are well based, no assurance can be given that amounts on deposit in checking and passbook and statement accounts
will not significantly change or be repriced in the event of a general change in interest rates. At December 31, 1999, money market accounts and 10% of checking accounts were
included in amounts repricing within one year, and 27% and 30% of passbook and statement accounts were included in the less than 1 year and “1 to 3 Years” categories, respectively.
(3) Reflects a change in maturity/repricing assumptions from those at December 31, 1999. Certain low-rate money market accounts totaling $395.2 million were moved to the
“3+ Years” category due to a history of little or no repricing activity for the product types.
(4) Includes $671.5 million of callable FHLB advances, all of which have a call date beyond one year. Based upon market interest rates at December 31, 2000, $158.5 million of
these FHLB advances are included as repricing in the “1 to 3 Years” category which corresponds to their next call date, instead of in the “3+ Years” category, which corresponds
to their maturity date.
(5) Represents $300 million of unsettled callable FHLB advances that settle within 30 days. The call dates for these FHLB advances are beyond one year.
As previously noted, TCF also utilizes simulation models to esti-
mate the near-term effects (next twelve months) of changing inter-
est rates on its net interest income. Net interest income simulation
involves forecasting net interest income under a variety of scenar-
ios, including the level of interest rates, the shape of the yield curve,
and spreads between market interest rates. At December 31, 2000,
net interest income is estimated to increase by .4% over the next
twelve months if interest rates were to sustain an immediate increase
of 200 basis points. At December 31, 1999, net interest income was
estimated to increase by 1.2% assuming a similar change in interest
rates. If interest rates were to decline by 200 basis points, net inter-
est income is estimated to decrease by 3.9% over the next twelve
months. Simulations at December 31, 1999 projected a decrease in
net interest income of .3% assuming a similar change in interest rates.
Management exercises its best judgment in making assump-
tions regarding loan prepayments, early deposit withdrawals, and
other non-controllable events in estimating TCF’s exposure to
changes in interest rates. These assumptions are inherently uncer-
tain and, as a result, the simulation models cannot precisely esti-
mate net interest income or precisely predict the impact of a change