TCF Bank 2000 Annual Report Download - page 37
Download and view the complete annual report
Please find page 37 of the 2000 TCF Bank annual report below. You can navigate through the pages in the report by either clicking on the pages listed below, or by using the keyword search tool below to find specific information within the annual report.-
 1
1 -
2
-
3
-
4
-
5
-
6
-
7
-
8
-
9
-
10
-
11
-
12
-
13
-
14
-
15
-
16
-
17
-
18
-
19
-
20
-
21
-
22
-
23
-
24
-
25
-
26
-
 27
27 -
 28
28 -
 29
29 -
 30
30 -
 31
31 -
 32
32 -
 33
33 -
 34
34 -
 35
35 -
 36
36 -
 37
37 -
 38
38 -
 39
39 -
 40
40 -
 41
41 -
 42
42 -
 43
43 -
 44
44 -
 45
45 -
 46
46 -
 47
47 -
48
-
49
-
50
-
51
-
52
-
53
-
54
-
55
-
56
-
57
-
58
-
59
-
60
-
61
-
62
-
63
-
64
-
65
-
66
-
67
-
68
-
69
-
70
-
71
-
72
-
73
-
74
-
75
-
76
-
77
 |
 |
35
TCF
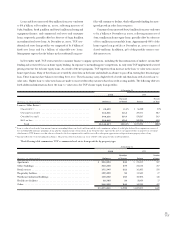
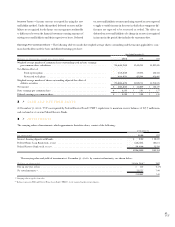
rates exceeded the contract rates on $53 million of the long-term
FHLB advances with call dates within one year. The weighted-aver-
age rate on borrowings increased to 6.23% at December 31, 2000,
from 5.91% at December 31, 1999, due to general increases in
interest rates. At December 31, 2000, borrowings with a maturity
of one year or less totaled $1.5 billion. Management has entered
into additional long-term callable FHLB advances to extend the
maturity of $300 million of TCF’s short-term borrowings. The
FHLB advances settle during the first quarter of 2001.
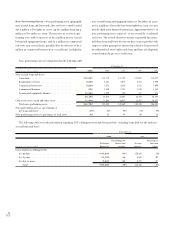
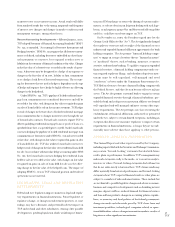
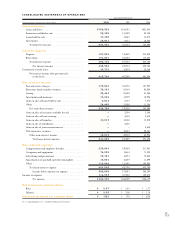
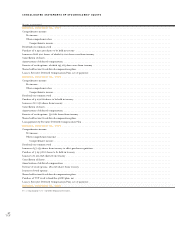
Stockholders’ Equity – Stockholders’ equity at December 31,
2000 was $910.2 million, or 8.1% of total assets, up from $809
million, or 7.6% of total assets, at December 31, 1999. The increase
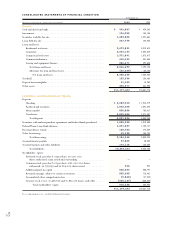
in stockholders’ equity is primarily due to net income of $186.2
million for the year ended December 31, 2000 and the decrease
of $37.5 million in accumulated other comprehensive loss, par-
tially offset by the repurchase of 3,243,800 shares of TCF’s com-
mon stock at a cost of $73.8 million and the payment of $66.1
million in dividends on common stock. Since January 1, 1998, the
Company has repurchased 14.9 million shares of TCF’s common
stock at an average cost of $26.26 per share.
Market Risk – Interest-Rate Risk – TCF’s results of oper-
ations are dependent to a large degree on its net interest income
and the Company’s ability to manage its interest-rate risk. Although
TCF manages other risks, such as credit and liquidity risk, in the
normal course of its business, the Company considers interest-
rate risk to be its most significant market risk. TCF, like most
financial institutions, has a material interest-rate risk exposure to
changes in both short-term and long-term interest rates as well as
variable index interest rates (e.g., prime). Since TCF does not
hold a trading portfolio, the Company is not exposed to market
risk from trading activities.
Like most financial institutions, TCF’s interest income and
cost of funds are significantly affected by general economic con-
ditions and by policies of regulatory authorities. The mismatch
between maturities and interest-rate sensitivities of assets and lia-
bilities results in interest-rate risk. TCF’s Asset/Liability
Management Committee manages TCF’s interest-rate risk based
on interest rate expectations and other factors. The principal objec-
tive of TCF’s asset/liability management activities is to provide
maximum levels of net interest income while maintaining accept-
able levels of interest-rate risk and liquidity risk and facilitating
the funding needs of the Company.
Although the measure is subject to a number of assumptions
and is only one of a number of measurements, management
believes the interest-rate gap (difference between interest-earn-
ing assets and interest-bearing liabilities repricing within a given
period) is an important indication of TCF’s exposure to interest-
rate risk and the related volatility of net interest income in a chang-
ing interest rate environment. In addition to the interest-rate gap
analysis, management also utilizes a simulation model to measure
and manage TCF’s interest-rate risk. For an institution with a neg-
ative interest-rate gap for a given period, the amount of its inter-
est-bearing liabilities maturing or otherwise repricing within such
period exceeds the amount of its interest-earning assets repricing
within the same period. In a rising interest-rate environment, insti-
tutions with negative interest-rate gaps will generally experience
more immediate increases in the cost of their liabilities than in the
yield on their assets. Conversely, the yield on assets for institutions
with negative interest-rate gaps will generally decrease more slowly
than the cost of their funds in a falling interest-rate environment.
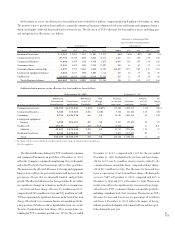
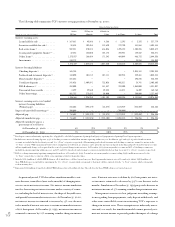
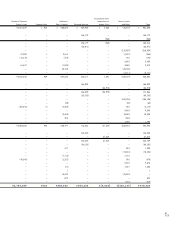
The amounts in the maturity/rate sensitivity table below rep-
resent management’s estimates and assumptions. The amounts
could be significantly affected by external factors such as prepay-
ment rates other than those assumed, early withdrawals of deposits,
changes in the correlation of various interest-bearing instruments,
competition, a general rise or decline in interest rates, and the
possibility that the FHLB will exercise its option to call certain of
TCF’s longer-term FHLB advances. Decisions by management to
purchase or sell assets, or retire debt could change the matu-
rity/repricing and spread relationships. In addition, TCF’s inter-
est-rate risk will increase during periods of rising interest rates
due to slower prepayments on loans and mortgage-backed secu-
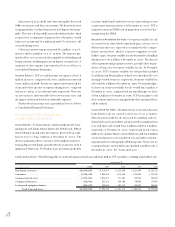
rities. TCF’s one-year adjusted interest-rate gap was a negative
$215.1 million, or (2)% of total assets, at December 31, 2000,
compared with a negative $1 billion, or (10)% of total assets, at
December 31, 1999. The decrease in TCF’s negative one-year
interest-rate gap reflects the impact of projected faster prepay-
ment rates on loan and mortgage-backed securities portfolios, and
a change in management’s maturity/repricing assumptions for
money market deposits.