TCF Bank 2000 Annual Report Download - page 35
Download and view the complete annual report
Please find page 35 of the 2000 TCF Bank annual report below. You can navigate through the pages in the report by either clicking on the pages listed below, or by using the keyword search tool below to find specific information within the annual report.-
 1
1 -
2
-
3
-
4
-
5
-
6
-
7
-
8
-
9
-
10
-
11
-
12
-
13
-
14
-
15
-
16
-
17
-
18
-
19
-
20
-
21
-
22
-
23
-
24
-
 25
25 -
 26
26 -
 27
27 -
 28
28 -
 29
29 -
 30
30 -
 31
31 -
 32
32 -
 33
33 -
 34
34 -
 35
35 -
 36
36 -
 37
37 -
 38
38 -
 39
39 -
 40
40 -
 41
41 -
 42
42 -
 43
43 -
 44
44 -
 45
45 -
46
-
47
-
48
-
49
-
50
-
51
-
52
-
53
-
54
-
55
-
56
-
57
-
58
-
59
-
60
-
61
-
62
-
63
-
64
-
65
-
66
-
67
-
68
-
69
-
70
-
71
-
72
-
73
-
74
-
75
-
76
-
77
 |
 |

33
TCF
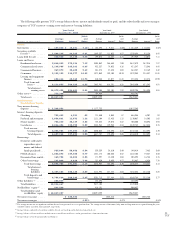
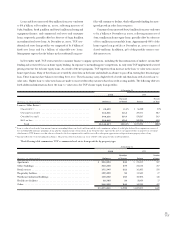
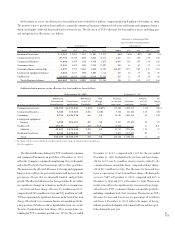
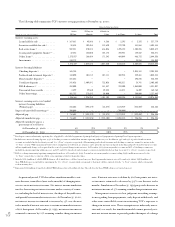
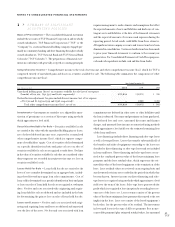
The over 30-day delinquency rate on TCF’s loans and leases (excluding loans held for sale and non-accrual loans and leases) was .69%
of loans and leases outstanding at December 31, 2000, compared with .42% at year-end 1999. TCF had $5 million of accruing loans and
leases 90 days or more past due at December 31, 2000, compared with $5.8 million at December 31, 1999. TCF’s delinquency rates are
determined using the contractual method. The following table sets forth information regarding TCF’s over 30-day delinquent loan and lease
portfolio, excluding loans held for sale and non-accrual loans and leases:
At December 31,
2000 1999
Principal Percentage of Principal Percentage of
(Dollars in thousands) Balances Portfolio Balances Portfolio
Consumer . . . . . . . . . . . . . . . . . . . . . . . . . . . . . . . . . . . . . . . . . . . . $20,628 .93% $19,076 .93%
Residential real estate . . . . . . . . . . . . . . . . . . . . . . . . . . . . . . . . . . . . 16,971 .46 11,552 .30
Commercial real estate . . . . . . . . . . . . . . . . . . . . . . . . . . . . . . . . . . . 1,793 .13 493 .05
Commercial business . . . . . . . . . . . . . . . . . . . . . . . . . . . . . . . . . . . . 3,958 .96 1,595 .46
Leasing and equipment finance . . . . . . . . . . . . . . . . . . . . . . . . . . . . . 15,508 1.83 386 .08
Total . . . . . . . . . . . . . . . . . . . . . . . . . . . . . . . . . . . . . . . . . . . $ 58,858 .69 $33,102 .42
TCF’s over 30-day delinquency rate on total consumer loans
was .93% at December 31, 2000, unchanged from year-end 1999.
TCF’s over 30-day delinquency on total leasing and equipment
finance increased to 1.83% at December 31, 2000 from .08% at
December 31, 1999. The increase can be attributed to the signif-
icant increase in activity in the leasing operations during 2000.
Included in delinquent leasing and equipment finance at December
31, 2000 are $2.4 million of leases that have been funded on a
non-recourse basis by third-party financial institutions.
Contributing to the increase in leasing and equipment finance
delinquencies is an increase in delinquencies for the truck and
trailer segment during the fourth quarter of 2000. At December
31, 2000, approximately $9.6 million of the truck and trailer seg-
ment was over 30-days delinquent. The rise in fuel prices has had
an adverse impact on the owner/operator trucking industry. These
operators may be experiencing financial difficulties and may be
unable to meet their lease obligations. Management continues to
monitor the leasing and equipment finance and consumer loan
portfolios, which will generally have higher delinquencies than
other categories. See “Loans and Leases.”
In addition to the non-accrual loans and leases, there were
commercial real estate and commercial business loans and lease
financings with an aggregate principal balance of $19.9 million
outstanding at December 31, 2000 for which management has
concerns regarding the ability of the borrowers to meet existing
repayment terms. This amount consists of loans and leases that were
classified for regulatory purposes as substandard or doubtful, or were
to borrowers that currently are experiencing financial difficulties
or that management believes may experience financial difficulties
in the future. This compares with $33 million of such loans and
leases at December 31, 1999. Although these loans and leases are
secured by commercial real estate or other corporate assets, they
may be subject to future modifications of their terms or may
become non-performing. Management monitors the performance
and classification of such loans and leases and the financial con-
dition of these borrowers.
Liquidity Management – TCF manages its liquidity position to
ensure that the funding needs of depositors and borrowers are met
promptly and in a cost-effective manner. Asset liquidity arises from
the ability to convert assets to cash as well as from the maturity of
assets. Liability liquidity results from the ability of TCF to attract a
diversity of funding sources to meet funding requirements promptly.
Deposits are the primary source of TCF’s funds for use in lend-
ing and for other general business purposes. In addition to
deposits, TCF derives funds primarily from loan and lease repay-
ments, proceeds from the discounting of leases, advances from the
FHLB and proceeds from reverse repurchase borrowing agree-
ments. Deposit inflows and outflows are significantly influenced
by general interest rates, money market conditions, competition
for funds and other factors. TCF’s deposit inflows and outflows
have been and will continue to be affected by these factors. See
“FORWARD-LOOKING INFORMATION.” Borrowings may be
used to compensate for reductions in normal sources of funds,
such as deposit inflows at less than projected levels, net deposit
outflows or to support expanded activities. Historically, TCF has
borrowed primarily from the FHLB, from institutional sources
under reverse repurchase agreements and, to a lesser extent, from
other sources. See “Borrowings.”