TCF Bank 2000 Annual Report Download - page 36
Download and view the complete annual report
Please find page 36 of the 2000 TCF Bank annual report below. You can navigate through the pages in the report by either clicking on the pages listed below, or by using the keyword search tool below to find specific information within the annual report.-
 1
1 -
2
-
3
-
4
-
5
-
6
-
7
-
8
-
9
-
10
-
11
-
12
-
13
-
14
-
15
-
16
-
17
-
18
-
19
-
20
-
21
-
22
-
23
-
24
-
25
-
 26
26 -
 27
27 -
 28
28 -
 29
29 -
 30
30 -
 31
31 -
 32
32 -
 33
33 -
 34
34 -
 35
35 -
 36
36 -
 37
37 -
 38
38 -
 39
39 -
 40
40 -
 41
41 -
 42
42 -
 43
43 -
 44
44 -
 45
45 -
 46
46 -
47
-
48
-
49
-
50
-
51
-
52
-
53
-
54
-
55
-
56
-
57
-
58
-
59
-
60
-
61
-
62
-
63
-
64
-
65
-
66
-
67
-
68
-
69
-
70
-
71
-
72
-
73
-
74
-
75
-
76
-
77
 |
 |

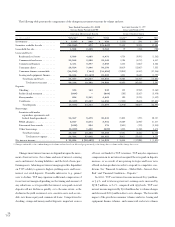
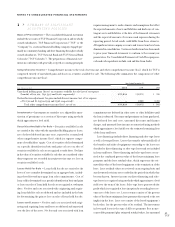
Potential sources of liquidity for TCF Financial Corporation
(parent company only) include cash dividends from TCF’s wholly
owned bank subsidiaries, issuance of equity securities, borrowings
under the Company’s $135 million bank line of credit and com-
mercial paper program, and interest income. TCF’s subsidiary
banks’ ability to pay dividends or make other capital distributions
to TCF is restricted by regulation and may require regulatory
approval. Undistributed earnings and profits at December 31,
2000 includes approximately $134.4 million for which no pro-
vision for federal income tax has been made. This amount repre-
sents earnings appropriated to bad debt reserves and deducted for
federal income tax purposes, and is generally not available for pay-
ment of cash dividends or other distributions to shareholders with-
out incurring an income tax liability based on the amount of
earnings removed and current tax rates.
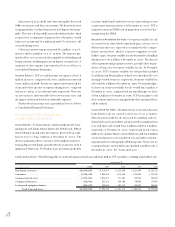
Deposits – Checking, savings and money market deposits are an
important source of lower cost funds and fee income for TCF.
Deposits totaled $6.9 billion at December 31, 2000, up $307 mil-
lion from December 31, 1999. As previously noted, TCF sold six
branches with $95.7 million of deposits during 2000. Lower inter-
est-cost checking, savings and money market deposits totaled $4.1
billion, up $373.2 million from December 31, 1999, and com-
prised 59.3% of total deposits at December 31, 2000. The average
balance of these deposits for 2000 was $3.9 billion, an increase of
$134.7 million over the $3.7 billion average balance for 1999.
Higher interest-cost certificates of deposit decreased $66.2 mil-
lion from December 31, 1999. The Company’s weighted-average
rate for deposits, including non-interest bearing deposits, increased
to 3.12% at December 31, 2000, from 2.71% at December 31, 1999,
due to increases in general levels of interest rates.
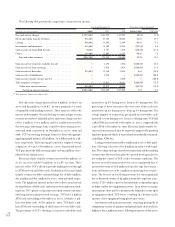
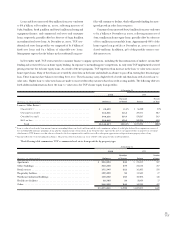
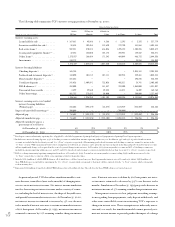
As previously noted, TCF continued to expand its supermarket banking franchise during 2000, opening 18 new branches during the year. TCF
now has 213 supermarket branches. During the past year, the number of deposit accounts in TCF’s supermarket branches increased 17.1% to over
646,000 accounts and the balances increased 30% to $1.1 billion. The average rate on these deposits increased from 2.24% at December 31, 1999
to 2.73% at December 31, 2000, due to general increases in interest rates. Additional information regarding TCF’s supermarket branches follows:
Supermarket Banking Summary At December 31,
Percentage
(Dollars in thousands) 2000 1999 Increase Change
Number of branches . . . . . . . . . . . . . . . . . . . . . . . . . . . . . . . . . . . . . 213 195 18 9.2%
Number of deposit accounts . . . . . . . . . . . . . . . . . . . . . . . . . . . . . . . 646,084 551,536 94,548 17.1
Deposits:
Checking . . . . . . . . . . . . . . . . . . . . . . . . . . . . . . . . . . . . . . . . . . $ 475,162 $354,074 $121,088 34.2
Passbook and statement . . . . . . . . . . . . . . . . . . . . . . . . . . . . . . . . 135,000 120,876 14,124 11.7
Money market . . . . . . . . . . . . . . . . . . . . . . . . . . . . . . . . . . . . . . . 108,557 60,169 48,388 80.4
Certificates . . . . . . . . . . . . . . . . . . . . . . . . . . . . . . . . . . . . . . . . . 354,891 290,579 64,312 22.1
Total deposits . . . . . . . . . . . . . . . . . . . . . . . . . . . . . . . . . . . . . $1,073,610 $825,698 $247,912 30.0
Average rate on deposits . . . . . . . . . . . . . . . . . . . . . . . . . . . . . . . . . . 2.73% 2.24% .49% 21.9
Total fees and other revenues for the year . . . . . . . . . . . . . . . . . . . . . . $ 112,043 $ 86,665 $ 25,378 29.3
Consumer loans outstanding . . . . . . . . . . . . . . . . . . . . . . . . . . . . . . . $ 233,393 $192,931 $ 40,462 21.0
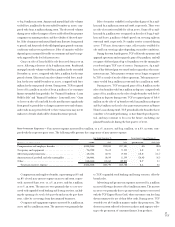
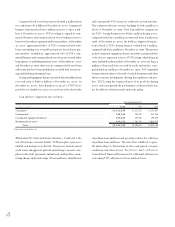
Borrowings – Borrowings totaled $3.2 billion at December 31,
2000, up $100.4 million from year-end 1999. The increase was
primarily due to increases of $131.3 million in FHLB advances
and $91 million in federal funds purchased, partially offset by
decreases of $42 million in TCF’s bank line of credit, $29.3 mil-
lion in treasury, tax and loan notes, $22.4 million in commercial
paper and $15.7 million in securities sold under agreements to
repurchase. See Note 10 of Notes to Consolidated Financial
Statements for detailed information on TCF’s borrowings.
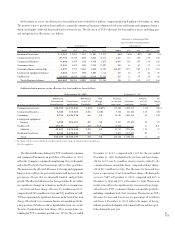
Included in FHLB advances at December 31, 2000 are $1.5 bil-
lion of fixed-rate advances which are callable at par on certain
anniversary dates and quarterly thereafter until maturity. If called,
the FHLB will provide replacement funding at the then-prevail-
ing market rate of interest for the remaining term-to-maturity of
the advances, subject to standard terms and conditions. Included
in FHLB advances are $688 million of long-term FHLB advances
that have call dates within one year. Due to changes in interest rates
since the long-term FHLB advances were obtained, the market
34
TCF