TCF Bank 2000 Annual Report Download - page 28
Download and view the complete annual report
Please find page 28 of the 2000 TCF Bank annual report below. You can navigate through the pages in the report by either clicking on the pages listed below, or by using the keyword search tool below to find specific information within the annual report.
26
TCF
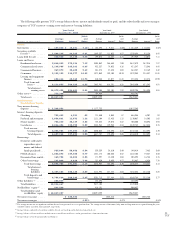
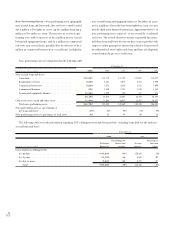
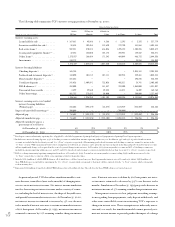
The following table presents the components of non-interest income:
Year Ended December 31, Percentage Increase (Decrease)
(Dollars in thousands) 2000 1999 1998 2000/1999 1999/1998
Fees and service charges . . . . . . . . . . . . . . . . . . . . . . . $ 179,563 $151,972 $127,952 18.2% 18.8%
Electronic funds transfer revenues . . . . . . . . . . . . . . . 78,101 67,144 50,556 16.3 32.8
Leasing . . . . . . . . . . . . . . . . . . . . . . . . . . . . . . . . . . . 38,442 28,505 31,344 34.9 (9.1)
Investments and insurance . . . . . . . . . . . . . . . . . . . . . 12,266 14,849 13,926 (17.4) 6.6
Gain on sales of loans held for sale . . . . . . . . . . . . . . . 4,012 4,747 7,575 (15.5) (37.3)
Other . . . . . . . . . . . . . . . . . . . . . . . . . . . . . . . . . . . . 16,405 12,009 11,156 36.6 7.6
Fees and other revenues . . . . . . . . . . . . . . . . . . . . 328,789 279,226 242,509 17.8 15.1
Gain on sales of securities available for sale . . . . . . . . . –3,194 2,246 (100.0) 42.2
Gain on sales of loan servicing . . . . . . . . . . . . . . . . . . –3,076 2,414 (100.0) 27.4
Gain on sales of branches . . . . . . . . . . . . . . . . . . . . . . 12,813 12,160 18,585 5.4 (34.6)
Gain on sale of subsidiaries . . . . . . . . . . . . . . . . . . . . –5,522 – (100.0) 100.0
Gain on sale of joint venture interest . . . . . . . . . . . . . –– 5,580 –(100.0)
Title insurance revenues (1) . . . . . . . . . . . . . . . . . . . . . –15,421 20,161 (100.0) (23.5)
Other non-interest income . . . . . . . . . . . . . . . . . . 12,813 39,373 48,986 (67.5) (19.6)
Total non-interest income . . . . . . . . . . . . . . . . $ 341,602 $318,599 $291,495 7.2 9.3
(1) Title insurance business was sold in 1999.
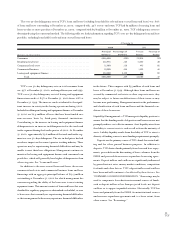
Fees and service charges increased $27.6 million, or 18.2%, in
2000 and $24 million, or 18.8%, in 1999, primarily as a result
of expanded retail banking activities. These increases reflect the
increase in the number of retail checking accounts and per account
revenues noted above. Included in fees and service charges are fees
of $10.3 million, $10.3 million and $13.7 million received for
the servicing of mortgage loans owned by others during 2000,
1999 and 1998, respectively. At December 31, 2000, 1999 and
1998, TCF was servicing mortgage loans for others with aggregate
unpaid principal balances of $4 billion, $2.9 billion and $3.7 bil-
lion, respectively. These mortgage loans had a weighted-average
coupon rate of 7.42% at December 31, 2000. As previously noted,
TCF purchased the bulk servicing rights on $933 million of res-
idential loans during 2000.
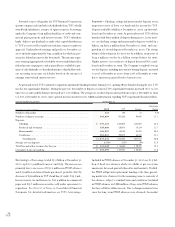
Electronic funds transfer revenues increased $11 million, or
16.3%, in 2000 and $16.6 million, or 32.8%, in 1999. These
increases reflect TCF’s efforts to provide banking services through
its ATM network and debit cards. Included in electronic funds
transfer revenues are debit card interchange fees of $28.7 million,
$19.5 million and $11.1 million for 2000, 1999 and 1998, respec-
tively. The significant increase in these fees reflects an increase in
the distribution of debit cards, and an increase in utilization result-
ing from TCF’s phone card promotion which rewards customers
with long distance minutes based on usage. TCF had 1.2 million
ATM cards outstanding at December 31, 2000, of which 1.1 mil-
lion were debit cards. At December 31, 1999, TCF had 1.1 mil-
lion ATM cards outstanding of which 929,000 were debit cards.
The percentage of TCF’s checking account base with debit cards
increased to 74.8% during 2000, from 71.6% during 1999. The
percentage of these customers who were active debit card users
increased to 49.3% during 2000, from 44.6% during 1999. The
average number of transactions per month on active debit cards
increased to 9.99 during 2000, from 9.01 during 1999. TCF had
1,384 ATMs in its network at December 31, 2000, compared with
1,406 ATMs at December 31, 1999. Electronic funds transfer rev-
enues in future periods may be negatively impacted by pending
legislative proposals which, if enacted and not judicially restrained,
could limit ATM fees.
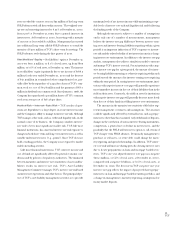
Leasing revenues increased $9.9 million in 2000 to $38.4 mil-
lion, following a decrease of $2.8 million in 1999 to $28.5 mil-
lion. The volume and type of new lease transactions and the resulting
revenues may fluctuate from period to period based upon factors
not within the control of TCF, such as economic conditions. The
increase in total leasing revenues for 2000 is primarily due to
increased revenue of $6.8 million from sales-type lease transac-
tions and an increase of $1.7 million in operating lease transac-
tions. The decrease in total leasing revenues for 1999 is primarily
due to decreased revenue of $4 million from sales-type lease trans-
actions. TCF’s ability to grow its lease portfolio is dependent upon
its ability to place new equipment in service. In an adverse economic
environment, there may be a decline in the demand for some types
of equipment which TCF leases, resulting in a decline in the
amount of new equipment being placed into service.
Investments and insurance income, consisting principally of
commissions on sales of annuities and mutual funds, decreased $2.6
million to $12.3 million in 2000, following an increase of $923,000


