TCF Bank 2000 Annual Report Download - page 69
Download and view the complete annual report
Please find page 69 of the 2000 TCF Bank annual report below. You can navigate through the pages in the report by either clicking on the pages listed below, or by using the keyword search tool below to find specific information within the annual report.-
 1
1 -
2
-
3
-
4
-
5
-
6
-
7
-
8
-
9
-
10
-
11
-
12
-
13
-
14
-
15
-
16
-
17
-
18
-
19
-
20
-
21
-
22
-
23
-
24
-
25
-
26
-
27
-
28
-
29
-
30
-
31
-
32
-
33
-
34
-
35
-
36
-
37
-
38
-
39
-
40
-
41
-
42
-
43
-
44
-
45
-
46
-
47
-
48
-
49
-
50
-
51
-
52
-
53
-
54
-
55
-
56
-
57
-
58
-
 59
59 -
 60
60 -
 61
61 -
 62
62 -
 63
63 -
 64
64 -
 65
65 -
 66
66 -
 67
67 -
 68
68 -
 69
69 -
 70
70 -
 71
71 -
 72
72 -
 73
73 -
 74
74 -
 75
75 -
 76
76 -
 77
77
 |
 |

67
TCF
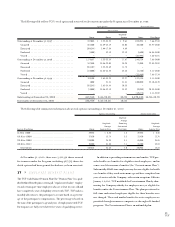
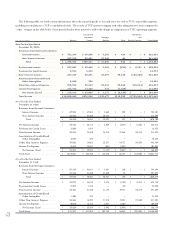
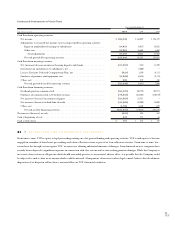
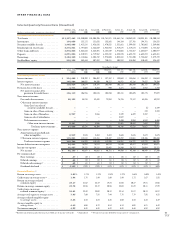
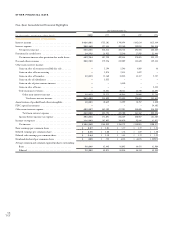
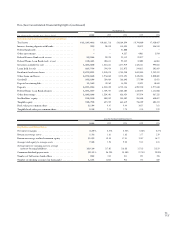
Selected Quarterly Financial Data (Unaudited)
At Dec. 31, At Sept. 30, At June 30, At March 31, At Dec. 31, At Sept. 30, At June 30, At March 31,
(Dollars in thousands, except per-share data) 2000 2000 2000 2000 1999 1999 1999 1999
Selected Financial Condition Data:
Total assets . . . . . . . . . . . . . . . . . . . . . . $11,197,462 $10,980,000 $10,905,705 $10,761,821 $10,661,716 $10,342,248 $10,338,341 $10,200,744
Investments . . . . . . . . . . . . . . . . . . . . . . 134,059 132,173 131,635 155,265 148,154 127,701 194,781 158,222
Securities available for sale . . . . . . . . . . . 1,403,888 1,413,218 1,436,836 1,470,532 1,521,661 1,599,438 1,701,063 1,569,406
Residential real estate loans . . . . . . . . . . 3,673,831 3,797,023 3,866,659 3,932,944 3,919,678 3,819,673 3,773,094 3,788,352
Other loans and leases . . . . . . . . . . . . . . 4,872,868 4,562,644 4,364,491 4,158,849 3,976,065 3,782,457 3,658,077 3,504,977
Deposits . . . . . . . . . . . . . . . . . . . . . . . . 6,891,824 6,810,921 6,719,962 6,823,248 6,584,835 6,633,738 6,648,283 6,632,481
Borrowings . . . . . . . . . . . . . . . . . . . . . . 3,184,245 3,115,066 3,205,732 2,975,080 3,083,888 2,721,200 2,734,652 2,579,789
Stockholders’ equity . . . . . . . . . . . . . . . . 910,220 859,444 807,382 780,311 808,982 815,304 810,448 824,442
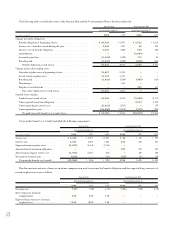
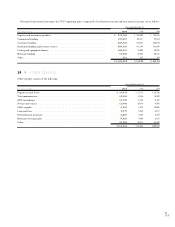
Three Months Ended
Dec. 31, Sept. 30, June 30, March 31, Dec. 31, Sept. 30, June 30, March 31,
2000 2000 2000 2000 1999 1999 1999 1999
Selected Operations Data:
Interest income . . . . . . . . . . . . . . . . . . . $ 214,408 $ 210,709 $ 204,407 $ 197,157 $ 193,043 $ 188,656 $ 186,359 $ 184,043
Interest expense . . . . . . . . . . . . . . . . . . . 103,584 100,035 94,209 90,317 86,931 82,116 79,637 79,204
Net interest income . . . . . . . . . . . . . 110,824 110,674 110,198 106,840 106,112 106,540 106,722 104,839
Provision for credit losses . . . . . . . . . . . . 4,711 3,688 5,383 990 3,371 2,845 2,947 7,760
Net interest income after
provision for credit losses . . . . . . 106,113 106,986 104,815 105,850 102,741 103,695 103,775 97,079
Non-interest income:
Fees and other revenues . . . . . . . . . . 88,122 85,276 82,438 72,953 74,785 72,137 68,385 63,919
Other non-interest income:
Gain (loss) on sales of
securities available for sale . . . . ––––––(5)3,199
Gain on sales of loan servicing . . . ––––––7432,333
Gain on sales of branches . . . . . . . 8,947 – 3,866 – 3,349 6,429 2,382 –
Gain on sale of subsidiaries . . . . . . –– – – 5,522 – – –
Title insurance revenues . . . . . . . –– – – 2,490 3,953 4,512 4,466
Other non-interest income . . 8,947 – 3,866 – 11,361 10,382 7,632 9,998
Total non-interest income . . 97,069 85,276 86,304 72,953 86,146 82,519 76,017 73,917
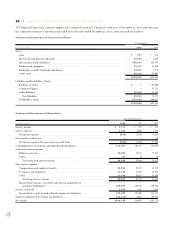
Non-interest expense:
Amortization of goodwill and
other intangibles . . . . . . . . . . . . . 2,519 2,515 2,484 2,483 2,665 2,676 2,673 2,675
Other non-interest expense . . . . . . . 115,841 113,818 112,761 110,107 112,292 114,061 110,106 105,650
Total non-interest expense . . . . . . 118,360 116,333 115,245 112,590 114,957 116,737 112,779 108,325
Income before income tax expense . . . . . . 84,822 75,929 75,874 66,213 73,930 69,477 67,013 62,671
Income tax expense . . . . . . . . . . . . . . . . 32,657 29,232 29,212 25,492 28,980 26,717 26,024 25,331
Net income . . . . . . . . . . . . . . . . . . . $ 52,165 $ 46,697 $ 46,662 $ 40,721 $ 44,950 $ 42,760 $ 40,989 $ 37,340
Per common share:
Basic earnings . . . . . . . . . . . . . . . . . $ .67 $ .60 $ .60 $ .51 $ .55 $ .52 $ .50 $ .45
Diluted earnings . . . . . . . . . . . . . . . . $ .66 $ .59 $ .59 $ .51 $ .55 $ .52 $ .49 $ .44
Diluted cash earnings(1) . . . . . . . . . . . $ .68 $ .61 $ .61 $ .53 $ .58 $ .54 $ .52 $ .47
Dividends declared . . . . . . . . . . . . . . $ .2125 $ .2125 $ .2125 $ .1875 $ .1875 $ .1875 $ .1875 $ .1625
Financial Ratios: (2)
Return on average assets . . . . . . . . . . . . . 1.89% 1.71% 1.73% 1.53% 1.72% 1.66% 1.60% 1.48%
Cash return on average assets(1) . . . . . . . . 1.96 1.78 1.80 1.60 1.80 1.73 1.67 1.55
Return on average realized
common equity . . . . . . . . . . . . . . . . 23.17 21.52 22.19 19.24 21.04 20.37 19.81 18.06
Return on average common equity . . . . . . 23.78 22.55 23.72 20.55 22.03 21.29 20.11 17.99
Cash return on average
realized common equity(1) . . . . . . . . . 24.01 22.39 23.09 20.12 22.14 21.27 20.73 18.97
Average total equity to average assets . . . 7.95 7.60 7.28 7.44 7.78 7.79 7.95 8.22
Average realized tangible equity
to average assets . . . . . . . . . . . . . . . . 6.66 6.43 6.23 6.35 6.50 6.44 6.33 6.39
Average tangible equity to
average assets . . . . . . . . . . . . . . . . . . 6.45 6.06 5.72 5.84 6.13 6.08 6.21 6.42
Net interest margin(3) . . . . . . . . . . . . . . . 4.33 4.38 4.38 4.32 4.38 4.46 4.52 4.52
(1)Excludes amortization and reduction of goodwill, net of income tax benefit. (2)Annualized. (3) Net interest income divided by average interest-earning assets.
OTHER FINANCIAL DATA