Supercuts 2011 Annual Report Download - page 86
Download and view the complete annual report
Please find page 86 of the 2011 Supercuts annual report below. You can navigate through the pages in the report by either clicking on the pages listed below, or by using the keyword search tool below to find specific information within the annual report.-
 1
1 -
2
-
3
-
4
-
5
-
6
-
7
-
8
-
9
-
10
-
11
-
12
-
13
-
14
-
15
-
16
-
17
-
18
-
19
-
20
-
21
-
22
-
23
-
24
-
25
-
26
-
27
-
28
-
29
-
30
-
31
-
32
-
33
-
34
-
35
-
36
-
37
-
38
-
39
-
40
-
41
-
42
-
43
-
44
-
45
-
46
-
47
-
48
-
49
-
50
-
51
-
52
-
53
-
54
-
55
-
56
-
57
-
58
-
59
-
60
-
61
-
62
-
63
-
64
-
65
-
66
-
67
-
68
-
69
-
70
-
71
-
72
-
73
-
74
-
75
-
 76
76 -
 77
77 -
 78
78 -
 79
79 -
 80
80 -
 81
81 -
 82
82 -
 83
83 -
 84
84 -
 85
85 -
 86
86 -
 87
87 -
 88
88 -
 89
89 -
 90
90 -
 91
91 -
 92
92 -
 93
93 -
 94
94 -
 95
95 -
 96
96 -
97
-
98
-
99
-
100
-
101
-
102
-
103
-
104
-
105
-
106
-
107
-
108
-
109
-
110
-
111
-
112
-
113
-
114
-
115
-
116
-
117
-
118
-
119
-
120
-
121
-
122
-
123
-
124
-
125
-
126
-
127
-
128
-
129
-
130
-
131
-
132
-
133
-
134
-
135
-
136
-
137
-
138
-
139
-
140
-
141
-
142
-
143
-
144
-
145
-
146
-
147
-
148
-
149
-
150
-
151
-
152
-
153
-
154
-
155
-
156
-
157
-
158
-
159
-
160
-
161
-
162
-
163
-
164
-
165
-
166
-
167
-
168
-
169
-
170
-
171
-
172
-
173
-
174
-
175
-
176
-
177
-
178
 |
 |

Table of Contents
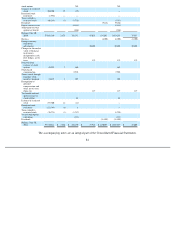
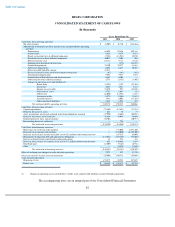
REGIS CORPORATION
CONSOLIDATED STATEMENT OF CASH FLOWS
(In thousands)
The accompanying notes are an integral part of the Consolidated Financial Statements.
82
Years Ended June 30,
2011 2010 2009
Cash flows from operating activities:
Net (loss) income
$
(8,905
)
$
42,740
$
(124,466
)
Adjustments to reconcile net (loss) income to net cash provided by operating
activities:
Depreciation
88,602
92,466
105,145
Amortization
9,826
9,870
9,871
Equity in (income) loss of affiliated companies
(7,228
)
(11,942
)
28,940
Dividends received from affiliated companies
10,023
2,404
906
Deferred income taxes
(14,711
)
5,115
(3,843
)
Impairment on discontinued operations
—
(
154
)
183,289
Goodwill impairment
74,100
35,277
41,661
Salon asset impairments
6,681
6,428
10,201
Note receivable bad debt expense
31,227
—
—
Excess tax benefits from stock
-
based compensation plans
(67
)
(243
)
(163
)
Stock
-
based compensation
9,596
9,337
7,525
Amortization of debt discount and financing costs
6,469
6,406
—
Other noncash items affecting earnings
1,578
(3,153
)
(3,405
)
Changes in operating assets and liabilities(1):
Receivables
(2,358
)
1,192
(12,104
)
Inventories
4,629
4,823
7,128
Income tax receivable
23,855
957
(34,652
)
Other current assets
4,725
2,657
(52
)
Other assets
(11,050
)
(14,951
)
(1,327
)
Accounts payable
(2,973
)
(4,966
)
(3,613
)
Accrued expenses
3,341
6,006
(23,364
)
Other noncurrent liabilities
1,818
1,954
387
Net cash provided by operating activities
229,178
192,223
188,064
Cash flows from investing activities:
Capital expenditures
(71,469
)
(57,821
)
(73,574
)
Proceeds from sale of assets
626
70
77
Asset acquisitions, net of cash acquired and certain obligations assumed
(17,990
)
(3,664
)
(40,051
)
Proceeds from loans and investments
16,804
16,099
19,008
Disbursements for loans and investments
(72,301
)
—
(
20,971
)
Freestanding derivative settlement
—
736
—
Net cash used in investing activities
(144,330
)
(44,580
)
(115,511
)
Cash flows from financing activities:
Borrowings on revolving credit facilities
—
337,000
6,391,100
Payments on revolving credit facilities
—
(
342,000
)
(6,525,200
)
Proceeds from issuance of long
-
term debt, net of $5.2 million underwriting discount
—
167,325
85,000
Repayments of long
-
term debt and capital lease obligations
(137,671
)
(349,175
)
(92,504
)
Excess tax benefits from stock
-
based compensation plans
67
243
163
Proceeds from issuance of common stock, net of $7.2 million underwriting discount
682
159,498
3,894
Dividends paid
(11,509
)
(9,146
)
(6,912
)
Other
—
(
2,878
)
(3,848
)
Net cash used in financing activities
(148,431
)
(39,133
)
(148,307
)
Effect of exchange rate changes on cash and cash equivalents
7,975
823
(9,335
)
(Decrease) increase in cash and cash equivalents
(55,608
)
109,333
(85,089
)
Cash and cash equivalents:
Beginning of year
151,871
42,538
127,627
End of year
$
96,263
$
151,871
$
42,538
(1)
Changes in operating assets and liabilities exclude assets acquired and liabilities assumed through acquisitions