Supercuts 2011 Annual Report Download - page 60
Download and view the complete annual report
Please find page 60 of the 2011 Supercuts annual report below. You can navigate through the pages in the report by either clicking on the pages listed below, or by using the keyword search tool below to find specific information within the annual report.-
 1
1 -
2
-
3
-
4
-
5
-
6
-
7
-
8
-
9
-
10
-
11
-
12
-
13
-
14
-
15
-
16
-
17
-
18
-
19
-
20
-
21
-
22
-
23
-
24
-
25
-
26
-
27
-
28
-
29
-
30
-
31
-
32
-
33
-
34
-
35
-
36
-
37
-
38
-
39
-
40
-
41
-
42
-
43
-
44
-
45
-
46
-
47
-
48
-
49
-
 50
50 -
 51
51 -
 52
52 -
 53
53 -
 54
54 -
 55
55 -
 56
56 -
 57
57 -
 58
58 -
 59
59 -
 60
60 -
 61
61 -
 62
62 -
 63
63 -
 64
64 -
 65
65 -
 66
66 -
 67
67 -
 68
68 -
 69
69 -
 70
70 -
71
-
72
-
73
-
74
-
75
-
76
-
77
-
78
-
79
-
80
-
81
-
82
-
83
-
84
-
85
-
86
-
87
-
88
-
89
-
90
-
91
-
92
-
93
-
94
-
95
-
96
-
97
-
98
-
99
-
100
-
101
-
102
-
103
-
104
-
105
-
106
-
107
-
108
-
109
-
110
-
111
-
112
-
113
-
114
-
115
-
116
-
117
-
118
-
119
-
120
-
121
-
122
-
123
-
124
-
125
-
126
-
127
-
128
-
129
-
130
-
131
-
132
-
133
-
134
-
135
-
136
-
137
-
138
-
139
-
140
-
141
-
142
-
143
-
144
-
145
-
146
-
147
-
148
-
149
-
150
-
151
-
152
-
153
-
154
-
155
-
156
-
157
-
158
-
159
-
160
-
161
-
162
-
163
-
164
-
165
-
166
-
167
-
168
-
169
-
170
-
171
-
172
-
173
-
174
-
175
-
176
-
177
-
178
 |
 |

Table of Contents
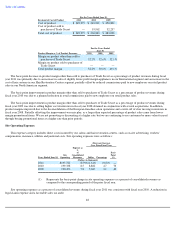
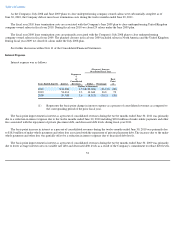
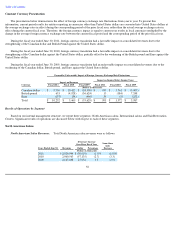
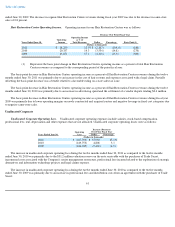
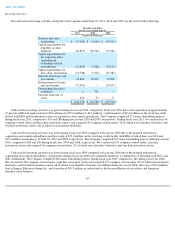
North American Salon Operating Income. Operating income for the North American salons was as follows:
The basis point decrease in North American salon operating income as a percent of North American salon revenues during fiscal year 2011
was primarily due to the $74.1 million goodwill impairment of the Company's Promenade salon concept and negative leverage in fixed cost
categories due to negative same-store sales. Partially offsetting the basis point decrease was lower depreciation expense due to a reduction in
salon construction.
The basis point decrease in North American salon operating income as a percent of North American salon revenues during fiscal year 2010
was primarily due to the $35.3 million goodwill impairment of the Company's Regis salon concept and negative leverage in fixed cost categories
due to negative same-store sales. In addition, the basis point decrease was due to the settlement of two legal claims regarding customer and
employee matters totaling $5.2 million, higher self insurance expense (the Company recorded reduction in self insurance accruals of $1.7 million
in the twelve months ended June 30, 2010 compared to a $9.9 million reduction in the twelve months ended June 30, 2009), partially offset by
the Company's cost saving initiatives and gross margin improvement.
The basis point decrease in North American salon operating income as a percent of North American salon revenues during fiscal year 2009
was primarily due to negative leverage in fixed cost categories due to negative same-store sales and lease termination costs associated with the
Company's plan to close underperforming company-owned salons. In addition, the basis point decrease was due to an increase in North
American revenues of $32.2 million related to product sales to the purchaser of Trade Secret at cost.
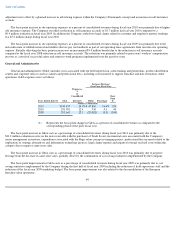
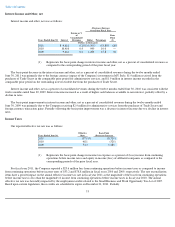
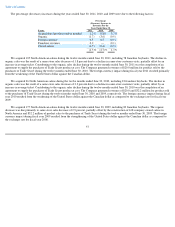
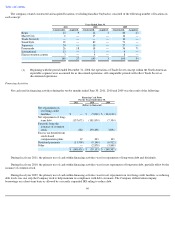
International Salons
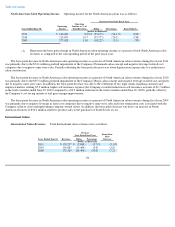
International Salon Revenues. Total International salon revenues were as follows:
58
Decrease Over Prior Fiscal Year
Years Ended June 30,
Operating
Income
Operating
Income as % of
Total Revenues
Dollar
Percentage
Basis Point(1)
(Dollars in thousands)
2011
$
166,683
8.2
%
$
(53,172
)
(24.2
)%
(250
)
2010
219,855
10.7
(55,773
)
(20.2
)
(230
)
2009
275,628
13.0
(10,227
)
(3.6
)
(70
)
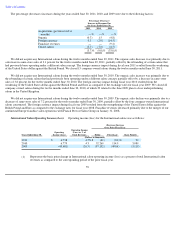
(1) Represents the basis point change in North American salon operating income as a percent of total North American salon
revenues as compared to the corresponding period of the prior fiscal year.
Decrease
Over Prior Fiscal Year
Same-Store
Sales
Decrease
Years Ended June 30, Revenues Dollar Percentage
(Dollars in thousands)
2011
$
150,237
$
(5,848
)
(3.7
)%
(3.1
)%
2010
156,085
(15,484
)
(9.0
)
(3.8
)
2009
171,569
(84,494
)
(33.0
)
(7.2
)