Supercuts 2011 Annual Report Download - page 31
Download and view the complete annual report
Please find page 31 of the 2011 Supercuts annual report below. You can navigate through the pages in the report by either clicking on the pages listed below, or by using the keyword search tool below to find specific information within the annual report.-
 1
1 -
2
-
3
-
4
-
5
-
6
-
7
-
8
-
9
-
10
-
11
-
12
-
13
-
14
-
15
-
16
-
17
-
18
-
19
-
20
-
 21
21 -
 22
22 -
 23
23 -
 24
24 -
 25
25 -
 26
26 -
 27
27 -
 28
28 -
 29
29 -
 30
30 -
 31
31 -
 32
32 -
 33
33 -
 34
34 -
 35
35 -
 36
36 -
 37
37 -
 38
38 -
 39
39 -
 40
40 -
 41
41 -
42
-
43
-
44
-
45
-
46
-
47
-
48
-
49
-
50
-
51
-
52
-
53
-
54
-
55
-
56
-
57
-
58
-
59
-
60
-
61
-
62
-
63
-
64
-
65
-
66
-
67
-
68
-
69
-
70
-
71
-
72
-
73
-
74
-
75
-
76
-
77
-
78
-
79
-
80
-
81
-
82
-
83
-
84
-
85
-
86
-
87
-
88
-
89
-
90
-
91
-
92
-
93
-
94
-
95
-
96
-
97
-
98
-
99
-
100
-
101
-
102
-
103
-
104
-
105
-
106
-
107
-
108
-
109
-
110
-
111
-
112
-
113
-
114
-
115
-
116
-
117
-
118
-
119
-
120
-
121
-
122
-
123
-
124
-
125
-
126
-
127
-
128
-
129
-
130
-
131
-
132
-
133
-
134
-
135
-
136
-
137
-
138
-
139
-
140
-
141
-
142
-
143
-
144
-
145
-
146
-
147
-
148
-
149
-
150
-
151
-
152
-
153
-
154
-
155
-
156
-
157
-
158
-
159
-
160
-
161
-
162
-
163
-
164
-
165
-
166
-
167
-
168
-
169
-
170
-
171
-
172
-
173
-
174
-
175
-
176
-
177
-
178
 |
 |
Table of Contents
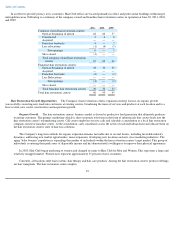
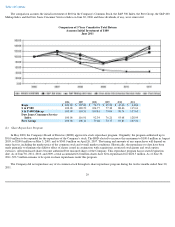
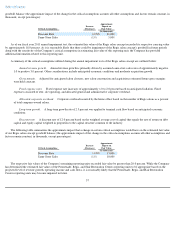
The comparison assumes the initial investment of $100 in the Company's Common Stock, the S&P 500 Index, the Peer Group, the S&P 400
Midcap Index and the Dow Jones Consumer Services Index on June 30, 2006 and those dividends, if any, were reinvested.
Comparison of 5 Year Cumulative Total Return
Assumes Initial Investment of $100
June 2011
(b) Share Repurchase Program
In May 2000, the Company's Board of Directors (BOD) approved a stock repurchase program. Originally, the program authorized up to
$50.0 million to be expended for the repurchase of the Company's stock. The BOD elected to increase this maximum to $100.0 million in August
2003, to $200.0 million on May 3, 2005, and to $300.0 million on April 26, 2007. The timing and amounts of any repurchases will depend on
many factors, including the market price of the common stock and overall market conditions. Historically, the repurchases to date have been
made primarily to eliminate the dilutive effect of shares issued in conjunction with acquisitions, restricted stock grants and stock option
exercises. All repurchased shares become authorized but unissued shares of the Company. This repurchase program has no stated expiration
date. As of June 30, 2011, 2010, and 2009, a total accumulated 6.8 million shares have been repurchased for $226.5 million. As of June 30,
2011, $73.5 million remains to be spent on share repurchases under this program.
The Company did not repurchase any of its common stock through its share repurchase program during the twelve months ended June 30,
2011.
29
2006
2007
2008
2009
2010
2011
Regis
$
100.00
$
107.86
$
74.71
$
49.90
$
45.06
$
44.86
S & P 500
100.00
120.59
104.77
77.30
88.46
115.61
S & P 400 Midcap
100.00
118.51
109.81
79.04
98.74
137.63
Dow Jones Consumer Service
Index
100.00
116.91
92.34
76.21
93.68
128.99
Peer Group
100.00
108.11
79.68
72.77
93.83
137.32