Supercuts 2011 Annual Report Download - page 45
Download and view the complete annual report
Please find page 45 of the 2011 Supercuts annual report below. You can navigate through the pages in the report by either clicking on the pages listed below, or by using the keyword search tool below to find specific information within the annual report.-
 1
1 -
2
-
3
-
4
-
5
-
6
-
7
-
8
-
9
-
10
-
11
-
12
-
13
-
14
-
15
-
16
-
17
-
18
-
19
-
20
-
21
-
22
-
23
-
24
-
25
-
26
-
27
-
28
-
29
-
30
-
31
-
32
-
33
-
34
-
 35
35 -
 36
36 -
 37
37 -
 38
38 -
 39
39 -
 40
40 -
 41
41 -
 42
42 -
 43
43 -
 44
44 -
 45
45 -
 46
46 -
 47
47 -
 48
48 -
 49
49 -
 50
50 -
 51
51 -
 52
52 -
 53
53 -
 54
54 -
 55
55 -
56
-
57
-
58
-
59
-
60
-
61
-
62
-
63
-
64
-
65
-
66
-
67
-
68
-
69
-
70
-
71
-
72
-
73
-
74
-
75
-
76
-
77
-
78
-
79
-
80
-
81
-
82
-
83
-
84
-
85
-
86
-
87
-
88
-
89
-
90
-
91
-
92
-
93
-
94
-
95
-
96
-
97
-
98
-
99
-
100
-
101
-
102
-
103
-
104
-
105
-
106
-
107
-
108
-
109
-
110
-
111
-
112
-
113
-
114
-
115
-
116
-
117
-
118
-
119
-
120
-
121
-
122
-
123
-
124
-
125
-
126
-
127
-
128
-
129
-
130
-
131
-
132
-
133
-
134
-
135
-
136
-
137
-
138
-
139
-
140
-
141
-
142
-
143
-
144
-
145
-
146
-
147
-
148
-
149
-
150
-
151
-
152
-
153
-
154
-
155
-
156
-
157
-
158
-
159
-
160
-
161
-
162
-
163
-
164
-
165
-
166
-
167
-
168
-
169
-
170
-
171
-
172
-
173
-
174
-
175
-
176
-
177
-
178
 |
 |

Table of Contents
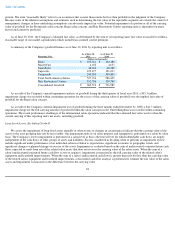
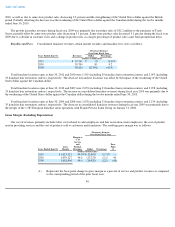
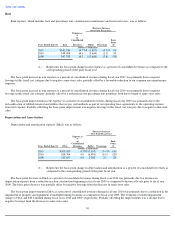
Consolidated Revenues
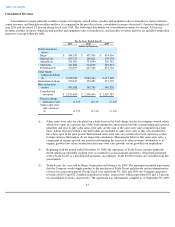
Consolidated revenues primarily include revenues of company-owned salons, product and equipment sales to franchisees, hair restoration
center revenues, and franchise royalties and fees. As compared to the prior fiscal year, consolidated revenues decreased 1.4 percent during fiscal
year 2011 and decreased 2.9 percent during fiscal year 2010. The following table details our consolidated revenues by concept. All service
revenues, product revenues (which include product and equipment sales to franchisees), and franchise royalties and fees are included within their
respective concept within the table.
43
For the Years Ended June 30,
2011
2010
2009
(Dollars in thousands)
North American
salons:
Regis
$
434,249
$
437,990
$
474,964
MasterCuts
165,729
166,821
170,338
SmartStyle
531,090
533,094
529,782
Supercuts
321,881
314,698
310,913
Promenade(3)
576,995
607,960
631,701
Total North
American Salons
(2)
2,029,944
2,060,563
2,117,698
International salons
150,237
156,085
171,569
Hair restoration
centers
145,688
141,786
140,520
Consolidated
revenues
$
2,325,869
$
2,358,434
$
2,429,787
Percent change
from prior year
(1.4
)%
(2.9
)%
(2.1
)%
Salon same-store
sales decrease
(1)
(1.7
)%
(3.2
)%
(3.1
)%
(1) Salon same-store sales are calculated on a daily basis as the total change in sales for company-owned salons
which were open on a specific day of the week during the current period and the corresponding prior period.
Quarterly and year-to-date salon same-store sales are the sum of the same-store sales computed on a daily
basis. Salons relocated within a one mile radius are included in same-store sales as they are considered to
have been open in the prior period. International same-store sales are calculated in local currencies so that
foreign currency fluctuations do not impact the calculation. Management believes that same-store sales, a
component of organic growth, are useful in determining the increase in salon revenues attributable to its
organic growth (new salon construction and same-store sales growth) versus growth from acquisitions.
(2) Beginning with the period ended December 31, 2008, the operations of Trade Secret concept within the
North American reportable segment were accounted for as discontinued operations. All periods presented
reflect Trade Secret as a discontinued operation. Accordingly, Trade Secret revenues are excluded from this
presentation.
(3)
Trade Secret, Inc. was sold by Regis Corporation on February 16, 2009. The agreement included a provision
that the Company would supply product to the purchaser of Trade Secret and provide certain administrative
services for a transition period. For the fiscal year ended June 30, 2010 and 2009, the Company generated
revenue of $20.0 and $32.2 million in product revenues, respectively, which represented 0.8 and 1.3 percent
of consolidated revenues, respectively. The agreement was substantially complete as of September 30, 2009.