Supercuts 2011 Annual Report Download - page 115
Download and view the complete annual report
Please find page 115 of the 2011 Supercuts annual report below. You can navigate through the pages in the report by either clicking on the pages listed below, or by using the keyword search tool below to find specific information within the annual report.
Table of Contents
NOTES TO CONSOLIDATED FINANCIAL STATEMENTS (Continued)
6. INVESTMENTS IN AND LOANS TO AFFILIATES (Continued)
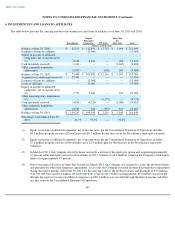
As of June 30, 2011, $1.9 and $2.2 million are recorded in the Consolidated Balance Sheet as current assets and investment in and loans to
affiliates, respectively, representing the Company's Exchangeable Note and outstanding note with MY Style. The exposure to loss related to the
Company's involvement with MY Style is the carrying value of the outstanding notes.
All foreign currency transaction gains and losses on the Exchangeable Note and MY Style Note are recorded through other income within
the Consolidated Statement of Operations. The foreign currency transaction (loss) gain was $(1.1), $3.1, and $2.1 million during fiscal years
2011, 2010, and 2009, respectively.
Investment in Hair Club for Men, Ltd.
The Company acquired a 50.0 percent interest in Hair Club for Men, Ltd. through its acquisition of Hair Club in fiscal year 2005. The
Company accounts for its investment in Hair Club for Men, Ltd. under the equity method of accounting. Hair Club for Men, Ltd. operates Hair
Club centers in Illinois and Wisconsin. During fiscal years 2011, 2010, and 2009, the Company recorded income and received dividends of $0.6
and $1.1 million, $0.9 and $1.3 million, and $0.6 and $0.9 million, respectively. The exposure to loss related to the Company's involvement with
Hair Club for Men, Ltd. is the carrying value of the investment.
7. FAIR VALUE MEASUREMENTS
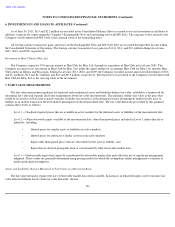
The fair value measurement guidance for financial and nonfinancial assets and liabilities defines fair value, establishes a framework for
measuring fair value and expands disclosure requirements about fair value measurements. This guidance defines fair value as the price that
would be received to sell an asset or paid to transfer a liability (an exit price) in the principal or most advantageous market for the asset or
liability in an orderly transaction between market participants on the measurement date. The fair value hierarchy prescribed by this guidance
contains three levels as follows:
Level 1 —Unadjusted quoted prices that are available in active markets for the identical assets or liabilities at the measurement date.
Level 2 —Other observable inputs available at the measurement date, other than quoted prices included in Level 1, either directly or
indirectly, including:
•
Quoted prices for similar assets or liabilities in active markets;
• Quoted prices for identical or similar assets in non-active markets;
• Inputs other than quoted prices that are observable for the asset or liability; and
•
Inputs that are derived principally from or corroborated by other observable market data.
Level 3 —Unobservable inputs that cannot be corroborated by observable market data and reflect the use of significant management
judgment. These values are generally determined using pricing models for which the assumptions utilize management's estimates of
market participant assumptions.
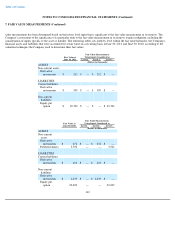
Assets and Liabilities that are Measured at Fair Value on a Recurring Basis
The fair value hierarchy requires the use of observable market data when available. In instances in which the inputs used to measure fair
value fall into different levels of the fair value hierarchy, the fair
111


