Supercuts 2011 Annual Report Download - page 61
Download and view the complete annual report
Please find page 61 of the 2011 Supercuts annual report below. You can navigate through the pages in the report by either clicking on the pages listed below, or by using the keyword search tool below to find specific information within the annual report.-
 1
1 -
2
-
3
-
4
-
5
-
6
-
7
-
8
-
9
-
10
-
11
-
12
-
13
-
14
-
15
-
16
-
17
-
18
-
19
-
20
-
21
-
22
-
23
-
24
-
25
-
26
-
27
-
28
-
29
-
30
-
31
-
32
-
33
-
34
-
35
-
36
-
37
-
38
-
39
-
40
-
41
-
42
-
43
-
44
-
45
-
46
-
47
-
48
-
49
-
50
-
 51
51 -
 52
52 -
 53
53 -
 54
54 -
 55
55 -
 56
56 -
 57
57 -
 58
58 -
 59
59 -
 60
60 -
 61
61 -
 62
62 -
 63
63 -
 64
64 -
 65
65 -
 66
66 -
 67
67 -
 68
68 -
 69
69 -
 70
70 -
 71
71 -
72
-
73
-
74
-
75
-
76
-
77
-
78
-
79
-
80
-
81
-
82
-
83
-
84
-
85
-
86
-
87
-
88
-
89
-
90
-
91
-
92
-
93
-
94
-
95
-
96
-
97
-
98
-
99
-
100
-
101
-
102
-
103
-
104
-
105
-
106
-
107
-
108
-
109
-
110
-
111
-
112
-
113
-
114
-
115
-
116
-
117
-
118
-
119
-
120
-
121
-
122
-
123
-
124
-
125
-
126
-
127
-
128
-
129
-
130
-
131
-
132
-
133
-
134
-
135
-
136
-
137
-
138
-
139
-
140
-
141
-
142
-
143
-
144
-
145
-
146
-
147
-
148
-
149
-
150
-
151
-
152
-
153
-
154
-
155
-
156
-
157
-
158
-
159
-
160
-
161
-
162
-
163
-
164
-
165
-
166
-
167
-
168
-
169
-
170
-
171
-
172
-
173
-
174
-
175
-
176
-
177
-
178
 |
 |

Table of Contents
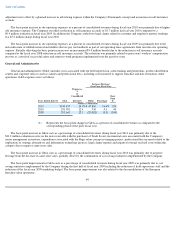
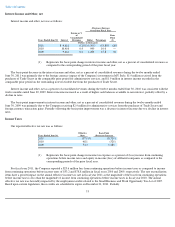
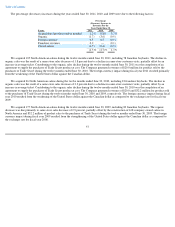
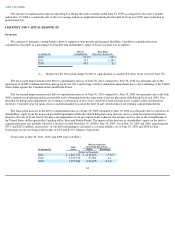
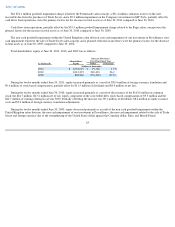
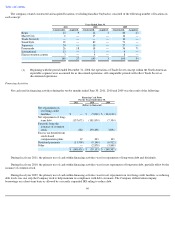
The percentage (decreases) increases during the years ended June 30, 2011, 2010, and 2009 were due to the following factors:
We did not acquire any International salons during the twelve months ended June 30, 2011. The organic sales decrease was primarily due to
a decrease in same-store sales of 3.1 percent for the twelve months ended June 30, 2011, partially offset by the rebranding of certain salons that
had previously been operating under a different salon concept. The foreign currency impact during fiscal year 2011 resulted from the weakening
of the United States dollar against the British Pound. We closed 15 company-owned salons during the twelve months ended June 30, 2011.
We did not acquire any International salons during the twelve months ended June 30, 2010. The organic sales increase was primarily due to
the rebranding of certain salons that had previously been operating under a different salon concept, partially offset by a decrease in same-store
sales of 3.8 percent for the twelve months ended June 30, 2010. The foreign currency impact during fiscal year 2010 resulted from the
weakening of the United States dollar against the British Pound and Euro as compared to the exchange rates for fiscal year 2009. We closed 42
company-owned salons during the twelve months ended June 30, 2010, of which 29 related to the June 2009 plan to close underperforming
salons in the United Kingdom.
We did not acquire any International salons during the twelve months ended June 30, 2009. The organic sales decline was primarily due to a
decrease of same-store sales of 7.2 percent for the twelve months ended June 30, 2009, partially offset by the four company-owned international
salons constructed. The foreign currency impact during fiscal year 2009 resulted from the strengthening of the United States dollar against the
British Pound and Euro as compared to the exchange rates for fiscal year 2008. Franchise revenues decreased primarily due to the merger of our
continental Europe franchise salon operations with Franck Provost Salon Group on January 31, 2008.
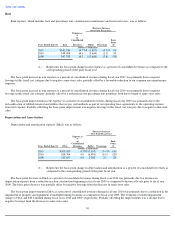
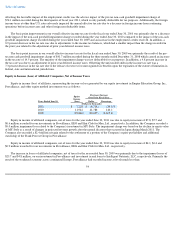
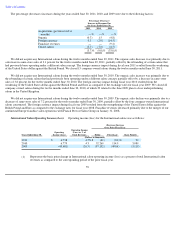
International Salon Operating Income (Loss). Operating income (loss) for the International salons was as follows:
59
Percentage (Decrease)
Increase in Revenues For
the Years Ended June 30,
2011 2010 2009
Acquisitions (previous twelve
months)
—
%
—
%
—
%
Organic
(0.3
)
1.5
(4.8
)
Foreign currency
0.3
(2.9
)
(14.5
)
Franchise revenues
—
—
(
9.2
)
Closed salons
(3.7
)
(7.6
)
(4.5
)
(3.7
)%
(9.0
)%
(33.0
)%
(Decrease) Increase
Over Prior Fiscal Year
Years Ended June 30, Operating
Income (Loss)
Operating Income
(Loss) as % of
Total Revenues Dollar Percentage Basis Point(1)
(Dollars in thousands)
2011
$
6,738
4.5
%
$
(41
)
(0.6
)%
20
2010
6,779
4.3
52,260
114.9
3,080
2009
(45,481
)
(26.5
)
(57,132
)
(490.4
)
(3,110
)
(1) Represents the basis point change in International salon operating income (loss) as a percent of total International salon
revenues as compared to the corresponding period of the prior fiscal year.