Supercuts 2011 Annual Report Download - page 64
Download and view the complete annual report
Please find page 64 of the 2011 Supercuts annual report below. You can navigate through the pages in the report by either clicking on the pages listed below, or by using the keyword search tool below to find specific information within the annual report.-
 1
1 -
2
-
3
-
4
-
5
-
6
-
7
-
8
-
9
-
10
-
11
-
12
-
13
-
14
-
15
-
16
-
17
-
18
-
19
-
20
-
21
-
22
-
23
-
24
-
25
-
26
-
27
-
28
-
29
-
30
-
31
-
32
-
33
-
34
-
35
-
36
-
37
-
38
-
39
-
40
-
41
-
42
-
43
-
44
-
45
-
46
-
47
-
48
-
49
-
50
-
51
-
52
-
53
-
 54
54 -
 55
55 -
 56
56 -
 57
57 -
 58
58 -
 59
59 -
 60
60 -
 61
61 -
 62
62 -
 63
63 -
 64
64 -
 65
65 -
 66
66 -
 67
67 -
 68
68 -
 69
69 -
 70
70 -
 71
71 -
 72
72 -
 73
73 -
 74
74 -
75
-
76
-
77
-
78
-
79
-
80
-
81
-
82
-
83
-
84
-
85
-
86
-
87
-
88
-
89
-
90
-
91
-
92
-
93
-
94
-
95
-
96
-
97
-
98
-
99
-
100
-
101
-
102
-
103
-
104
-
105
-
106
-
107
-
108
-
109
-
110
-
111
-
112
-
113
-
114
-
115
-
116
-
117
-
118
-
119
-
120
-
121
-
122
-
123
-
124
-
125
-
126
-
127
-
128
-
129
-
130
-
131
-
132
-
133
-
134
-
135
-
136
-
137
-
138
-
139
-
140
-
141
-
142
-
143
-
144
-
145
-
146
-
147
-
148
-
149
-
150
-
151
-
152
-
153
-
154
-
155
-
156
-
157
-
158
-
159
-
160
-
161
-
162
-
163
-
164
-
165
-
166
-
167
-
168
-
169
-
170
-
171
-
172
-
173
-
174
-
175
-
176
-
177
-
178
 |
 |

Table of Contents
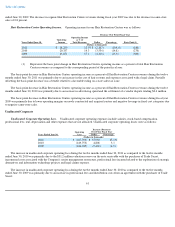
The decrease in unallocated corporate operating loss during the twelve months ended June 30, 2009 as compared to the twelve months
ended June 30, 2008 was primarily due to the cost savings initiatives implemented during the first half of fiscal year 2009 and a reduction in
professional fees.
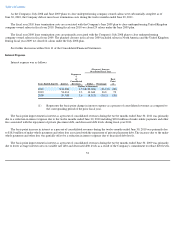
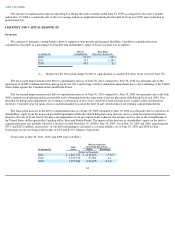
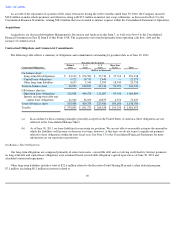
LIQUIDITY AND CAPITAL RESOURCES
Overview
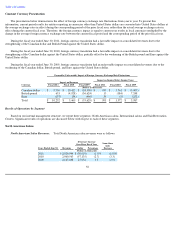
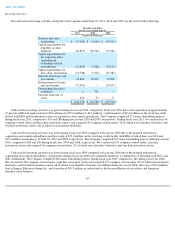
We continue to maintain a strong balance sheet to support system growth and financial flexibility. Our debt to capitalization ratio,
calculated as total debt as a percentage of total debt and shareholders' equity at fiscal year end, was as follows:
The basis point improvement in the debt to capitalization ratio as of June 30, 2011 compared to June 30, 2010 was primarily due to the
repayment of an $85.0 million term loan during fiscal year 2011 and foreign currency translation adjustments due to the weakening of the United
States dollar against the Canadian dollar and British Pound.
The basis point improvement in the debt to capitalization ratio as of June 30, 2010 compared to June 30, 2009 was primarily due to the July
2009 common stock offering and decreased debt levels stemming from the repayment of private placement debt during fiscal year 2010. Our
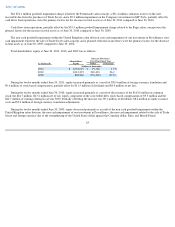
principal on-going cash requirements are to finance construction of new stores, remodel certain existing stores, acquire salons and purchase
inventory. Customers pay for salon services and merchandise in cash at the time of sale, which reduces our working capital requirements.
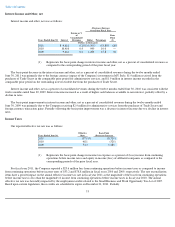
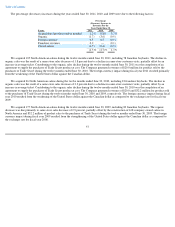
The basis point increase in the debt to capitalization ratio as of June 30, 2009 compared to June 30, 2008 was primarily due to a decrease in
shareholders' equity from the non-cash goodwill impairment within the United Kingdom salon division, the loss from discontinued operations
related to the sale of Trade Secret, the non-cash impairment of our investment in Provalliance and foreign currency due to the strengthening of
the United States dollar against the Canadian dollar, Euro and British Pound. The impact of the decrease in shareholders' equity on the debt to
capitalization ratio was partially offset by a decrease in debt from June 30, 2008 to June 30, 2009. As of June 30, 2009 and 2008, approximately
$55.5 and $230.2 million, respectively, of our debt outstanding is classified as a current liability. As of June 30, 2009 and 2008 we had
borrowings on our revolving credit facility of $5.0 and $139.1 million, respectively.
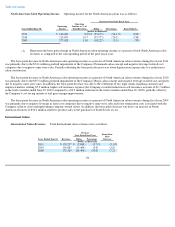
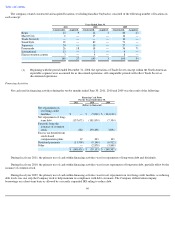
Total assets at June 30, 2011, 2010, and 2009 were as follows:
62
As of June 30,
Debt to
Capitalization
Basis Point
(Decrease) Increase(1)
2011
23.3
%
(700
)
2010
30.3
(1,380
)
2009
44.1
20
(1)
Represents the basis point change in debt to capitalization as compared to prior fiscal year end (June 30).
(Decrease) Increase
Over Prior Fiscal Year
Total
Assets
As of June 30,
Dollar
Percentage
(Dollars in thousands)
2011
$
1,805,753
$
(113,819
)
(5.9
)%
2010
1,919,572
27,086
1.4
2009
1,892,486
(343,385
)
(15.4
)