Supercuts 2011 Annual Report Download - page 53
Download and view the complete annual report
Please find page 53 of the 2011 Supercuts annual report below. You can navigate through the pages in the report by either clicking on the pages listed below, or by using the keyword search tool below to find specific information within the annual report.-
 1
1 -
2
-
3
-
4
-
5
-
6
-
7
-
8
-
9
-
10
-
11
-
12
-
13
-
14
-
15
-
16
-
17
-
18
-
19
-
20
-
21
-
22
-
23
-
24
-
25
-
26
-
27
-
28
-
29
-
30
-
31
-
32
-
33
-
34
-
35
-
36
-
37
-
38
-
39
-
40
-
41
-
42
-
 43
43 -
 44
44 -
 45
45 -
 46
46 -
 47
47 -
 48
48 -
 49
49 -
 50
50 -
 51
51 -
 52
52 -
 53
53 -
 54
54 -
 55
55 -
 56
56 -
 57
57 -
 58
58 -
 59
59 -
 60
60 -
 61
61 -
 62
62 -
 63
63 -
64
-
65
-
66
-
67
-
68
-
69
-
70
-
71
-
72
-
73
-
74
-
75
-
76
-
77
-
78
-
79
-
80
-
81
-
82
-
83
-
84
-
85
-
86
-
87
-
88
-
89
-
90
-
91
-
92
-
93
-
94
-
95
-
96
-
97
-
98
-
99
-
100
-
101
-
102
-
103
-
104
-
105
-
106
-
107
-
108
-
109
-
110
-
111
-
112
-
113
-
114
-
115
-
116
-
117
-
118
-
119
-
120
-
121
-
122
-
123
-
124
-
125
-
126
-
127
-
128
-
129
-
130
-
131
-
132
-
133
-
134
-
135
-
136
-
137
-
138
-
139
-
140
-
141
-
142
-
143
-
144
-
145
-
146
-
147
-
148
-
149
-
150
-
151
-
152
-
153
-
154
-
155
-
156
-
157
-
158
-
159
-
160
-
161
-
162
-
163
-
164
-
165
-
166
-
167
-
168
-
169
-
170
-
171
-
172
-
173
-
174
-
175
-
176
-
177
-
178
 |
 |

Table of Contents
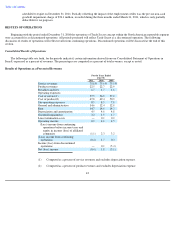
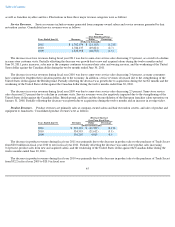
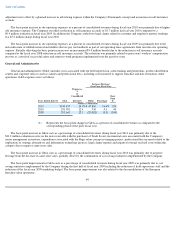
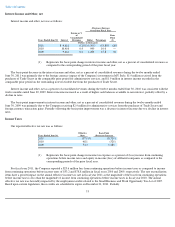
The basis point increase in D&A as a percent of consolidated revenues during fiscal year 2009 was primarily due to the decrease in same-
store sales. In addition, the Company recorded impairment charges of $10.2 million related to the impairment of property and equipment at
underperforming locations, including those salons under the Company approved plan to close up to 80 underperforming United Kingdom
company-owned salons.
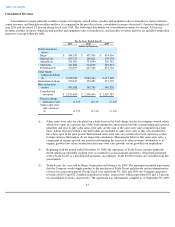
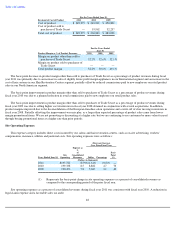
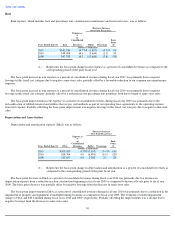
Goodwill Impairment
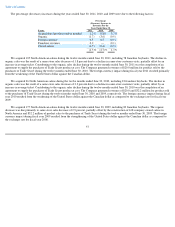
Goodwill impairment was as follows:
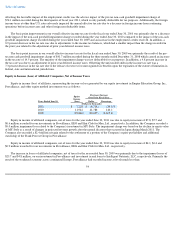
The Company recorded a $74.1 million goodwill impairment charge related to the Promenade salon concept during fiscal year 2011. Due to
lower than expected earnings and same-
store sales, the estimated fair value of the Promenade salon operations was less than the carrying value of
this concept's net assets, including goodwill. The $74.1 million impairment charge was the excess of the carrying value of goodwill over the
implied fair value of goodwill for the Promenade salon operations.
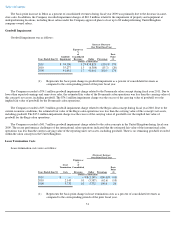
The Company recorded a $35.3 million goodwill impairment charge related to the Regis salon concept during fiscal year 2010. Due to the
current economic conditions, the estimated fair value of the Regis salon operations was less than the carrying value of this concept's net assets,
including goodwill. The $35.3 million impairment charge was the excess of the carrying value of goodwill over the implied fair value of
goodwill for the Regis salon operations.
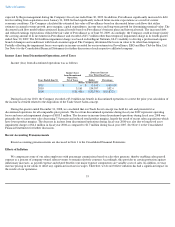
The Company recorded a $41.7 million goodwill impairment charge related to the salon concepts in the United Kingdom during fiscal year
2009. The recent performance challenges of the international salon operations indicated that the estimated fair value of the international salon
operations was less than the current carrying value of the reporting unit's net assets, including goodwill. There is no remaining goodwill recorded
within the salon concepts in the United Kingdom.
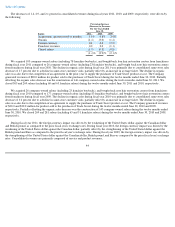
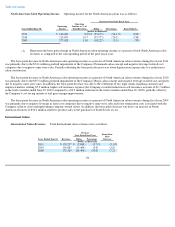
Lease Termination Costs
Lease termination costs were as follows:
51
Increase (Decrease)
Over Prior Fiscal Year
Years Ended June 30,
Goodwill
Impairment
Expense as
%
of
Consolidated
Revenues Dollar
Percentage
Basis
Point
(1)
(Dollars in thousands)
2011
$
74,100
3.2
%
$
38,823
110.1
%
170
2010
35,277
1.5
(6,384
)
(15.3
)
(20
)
2009
41,661
1.7
41,661
100.0
170
(1) Represents the basis point change in goodwill impairment as a percent of consolidated revenues as
compared to the corresponding period of the prior fiscal year.
(Decrease) Increase
Over Prior Fiscal Year
Years Ended June 30,
Lease
Termination
Costs
Expense as
%
of
Consolidated
Revenues Dollar
Percentage
Basis
Point
(1)
(Dollars in thousands)
2011
$
—
—
%
$
(
2,145
)
(100.0
)%
(10
)
2010
2,145
0.1
(3,587
)
(62.6
)
(10
)
2009
5,732
0.2
5,732
100.0
20
(1) Represents the basis point change in lease termination costs as a percent of consolidated revenues as
compared to the corresponding periods of the prior fiscal year.